


ISSN 1004-132X
CN 42-1294/TH
CN 42-1294/TH
中国机械工程 ›› 2026, Vol. 37 ›› Issue (4): 900-912.DOI: 10.3969/j.issn.1004-132X.2026.04.014
梁强1( ), 陈红1, 郑银鹏2, 王兵2, 杜彦斌1, 龙帅3
收稿日期:2025-10-27
出版日期:2026-04-25
发布日期:2026-05-11
通讯作者:
梁强
作者简介:梁强*(通信作者),男,1988年生,副教授。研究方向为精密塑性成形工艺及设计、模具制造及再制造。E-mail:2017015@ctbu.edu.cn。
基金资助:
LIANG Qiang1(), CHEN Hong1, ZHENG Yinpeng2, WANG Bing2, DU Yanbin1, LONG Shuai3
Received:2025-10-27
Online:2026-04-25
Published:2026-05-11
Contact:
LIANG Qiang
摘要:
为实现对球墨铸铁QT550-5表面激光硬化及其加工工艺参数的优化,构建了QT550-5激光硬化温度场与相变场耦合的有限元模型,以激光功率、扫描速度和搭接率为实验变量,将试样的硬化层深度和熔凝层深度作为优化目标,采用拉丁超立方抽样进行实验设计,并基于实验数据构建贝叶斯优化的多任务神经网络预测模型,进一步引入沙普利加性解释方法进行可解释性分析,明确各参数对激光硬化结果的贡献机制。采用多目标河马算法进行工艺参数寻优,并采用熵权法结合逼近理想解排序法构建一种综合评价体系,对非劣解集排序得到最佳工艺参数组合。最后采用最佳工艺参数组合进行实验验证,结果表明,QT550-5表面硬化效果显著。
中图分类号:
梁强, 陈红, 郑银鹏, 王兵, 杜彦斌, 龙帅. 面向QT550-5激光硬化工艺参数的可解释性模型构建与优化[J]. 中国机械工程, 2026, 37(4): 900-912.
LIANG Qiang, CHEN Hong, ZHENG Yinpeng, WANG Bing, DU Yanbin, LONG Shuai. Interpretable Modeling and Optimization of Laser Hardening Process Parameters for QT550-5[J]. China Mechanical Engineering, 2026, 37(4): 900-912.
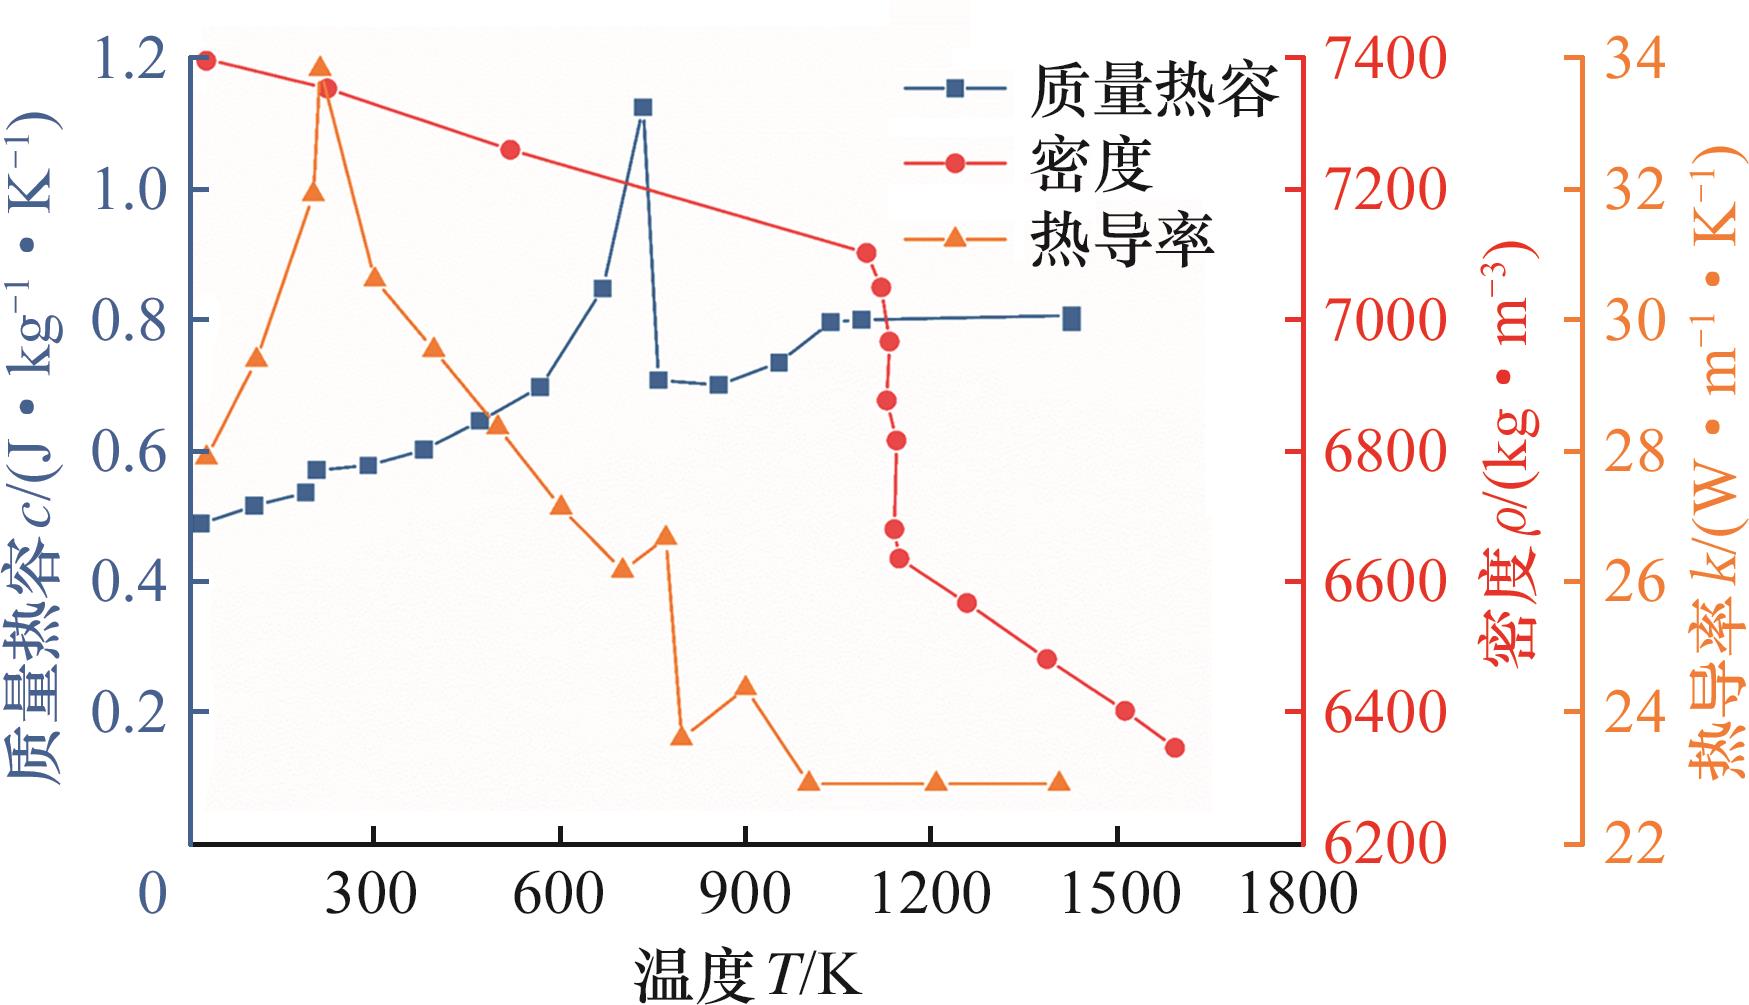
图1 球墨铸铁热物性参数变化
Fig.1 Variation of thermal properties of nodular cast iron
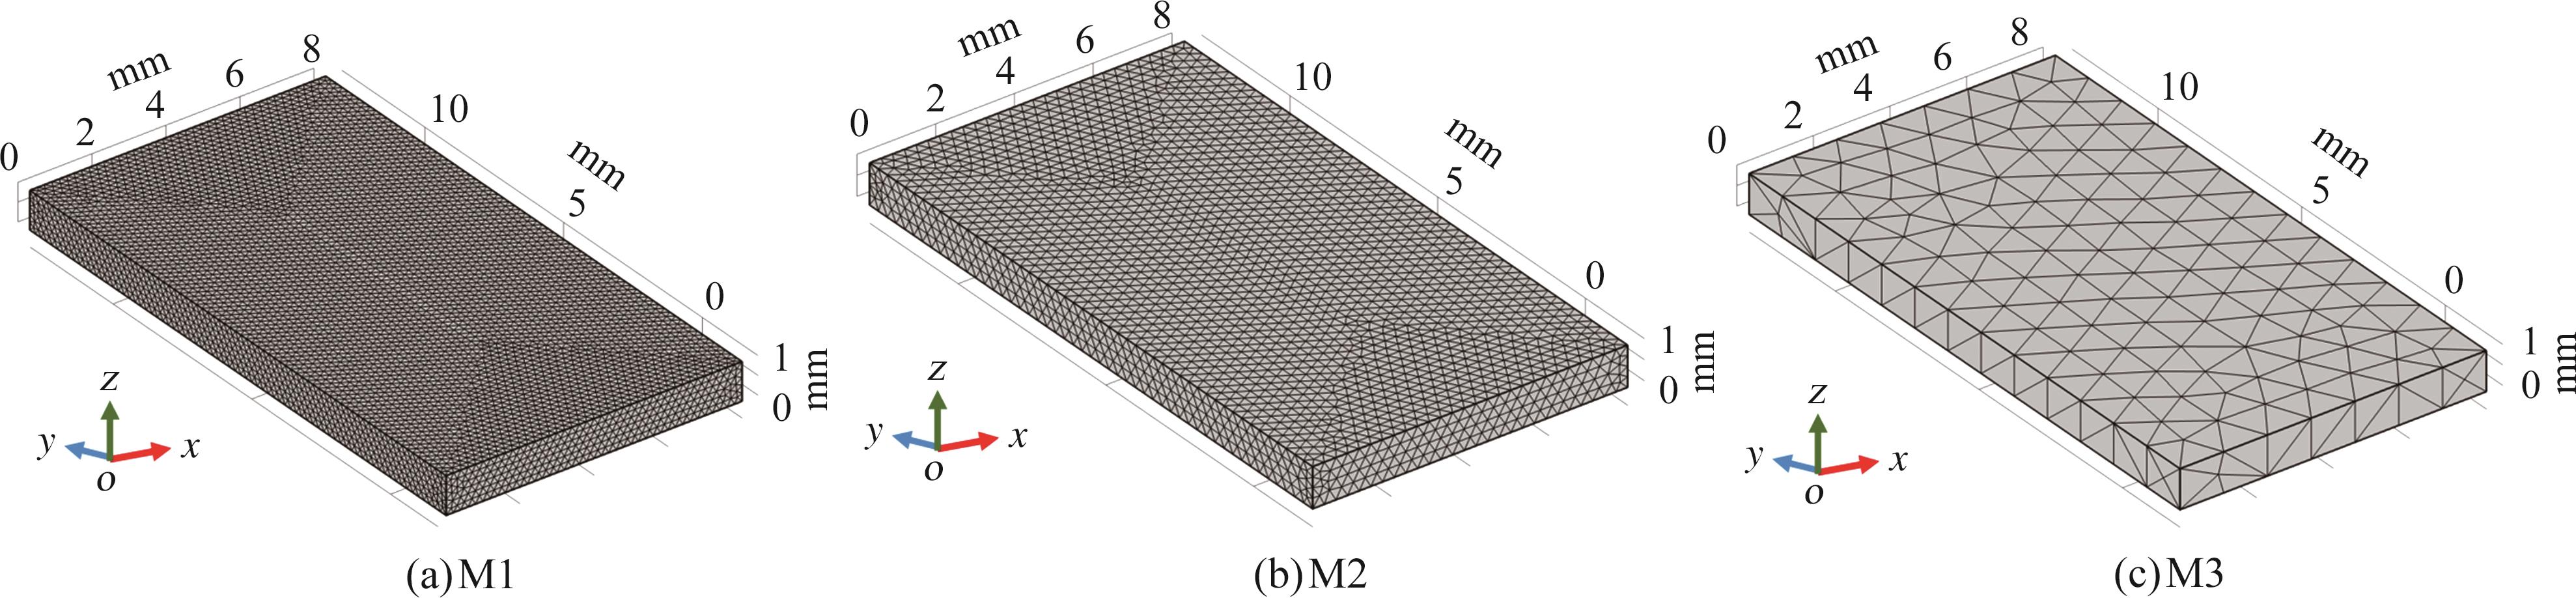
图2 网格分布情况
Fig.2 Distribution of meshes
| 网格尺寸 | 最大 单元 尺寸/ mm | 最小 单元 尺寸/ mm | 最大单元 增长率 | 狭窄区域分辨率 | h/μm | H/μm | t/s |
|---|---|---|---|---|---|---|---|
| M1 | 0.18 | 0.004 | 1.30 | 0.85 | 225 | 495 | 18 108 |
| M2 | 0.20 | 0.010 | 1.35 | 0.90 | 215 | 510 | 10 296 |
| M3 | 1.20 | 0.150 | 1.45 | 0.95 | 280 | 640 | 6592 |
表1 网格无关性验证
Tab.1 Mesh independence verification
| 网格尺寸 | 最大 单元 尺寸/ mm | 最小 单元 尺寸/ mm | 最大单元 增长率 | 狭窄区域分辨率 | h/μm | H/μm | t/s |
|---|---|---|---|---|---|---|---|
| M1 | 0.18 | 0.004 | 1.30 | 0.85 | 225 | 495 | 18 108 |
| M2 | 0.20 | 0.010 | 1.35 | 0.90 | 215 | 510 | 10 296 |
| M3 | 1.20 | 0.150 | 1.45 | 0.95 | 280 | 640 | 6592 |
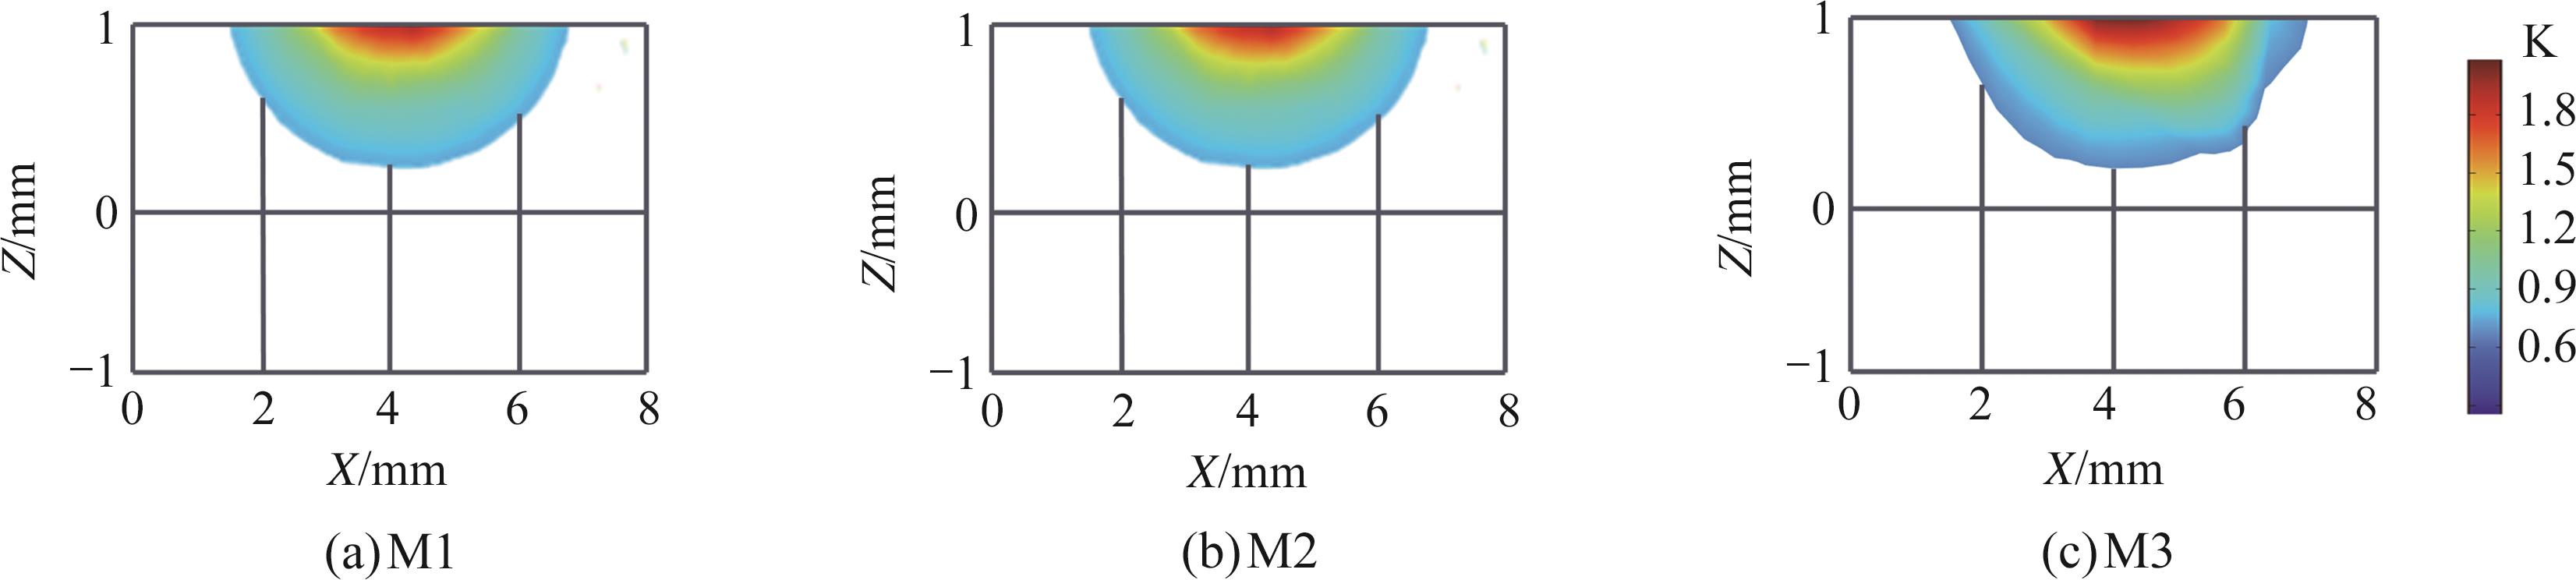
图3 相同时刻不同网格的温度场截面图
Fig.3 Cross-sectional temperature field with different meshes at the same time
| w(C) | w(Si) | w(Mn) | w(P) | w(S) | w(Cu) | w(Fe) |
|---|---|---|---|---|---|---|
| 3.5~3.9 | 2.2~2.7 | <0.4 | <0.06 | <0.02 | 0.04~0.08 | 其余 |
表2 QT550-5主要化学成分 (%)
Tab.2 Principal chemical composition of QT550-5
| w(C) | w(Si) | w(Mn) | w(P) | w(S) | w(Cu) | w(Fe) |
|---|---|---|---|---|---|---|
| 3.5~3.9 | 2.2~2.7 | <0.4 | <0.06 | <0.02 | 0.04~0.08 | 其余 |
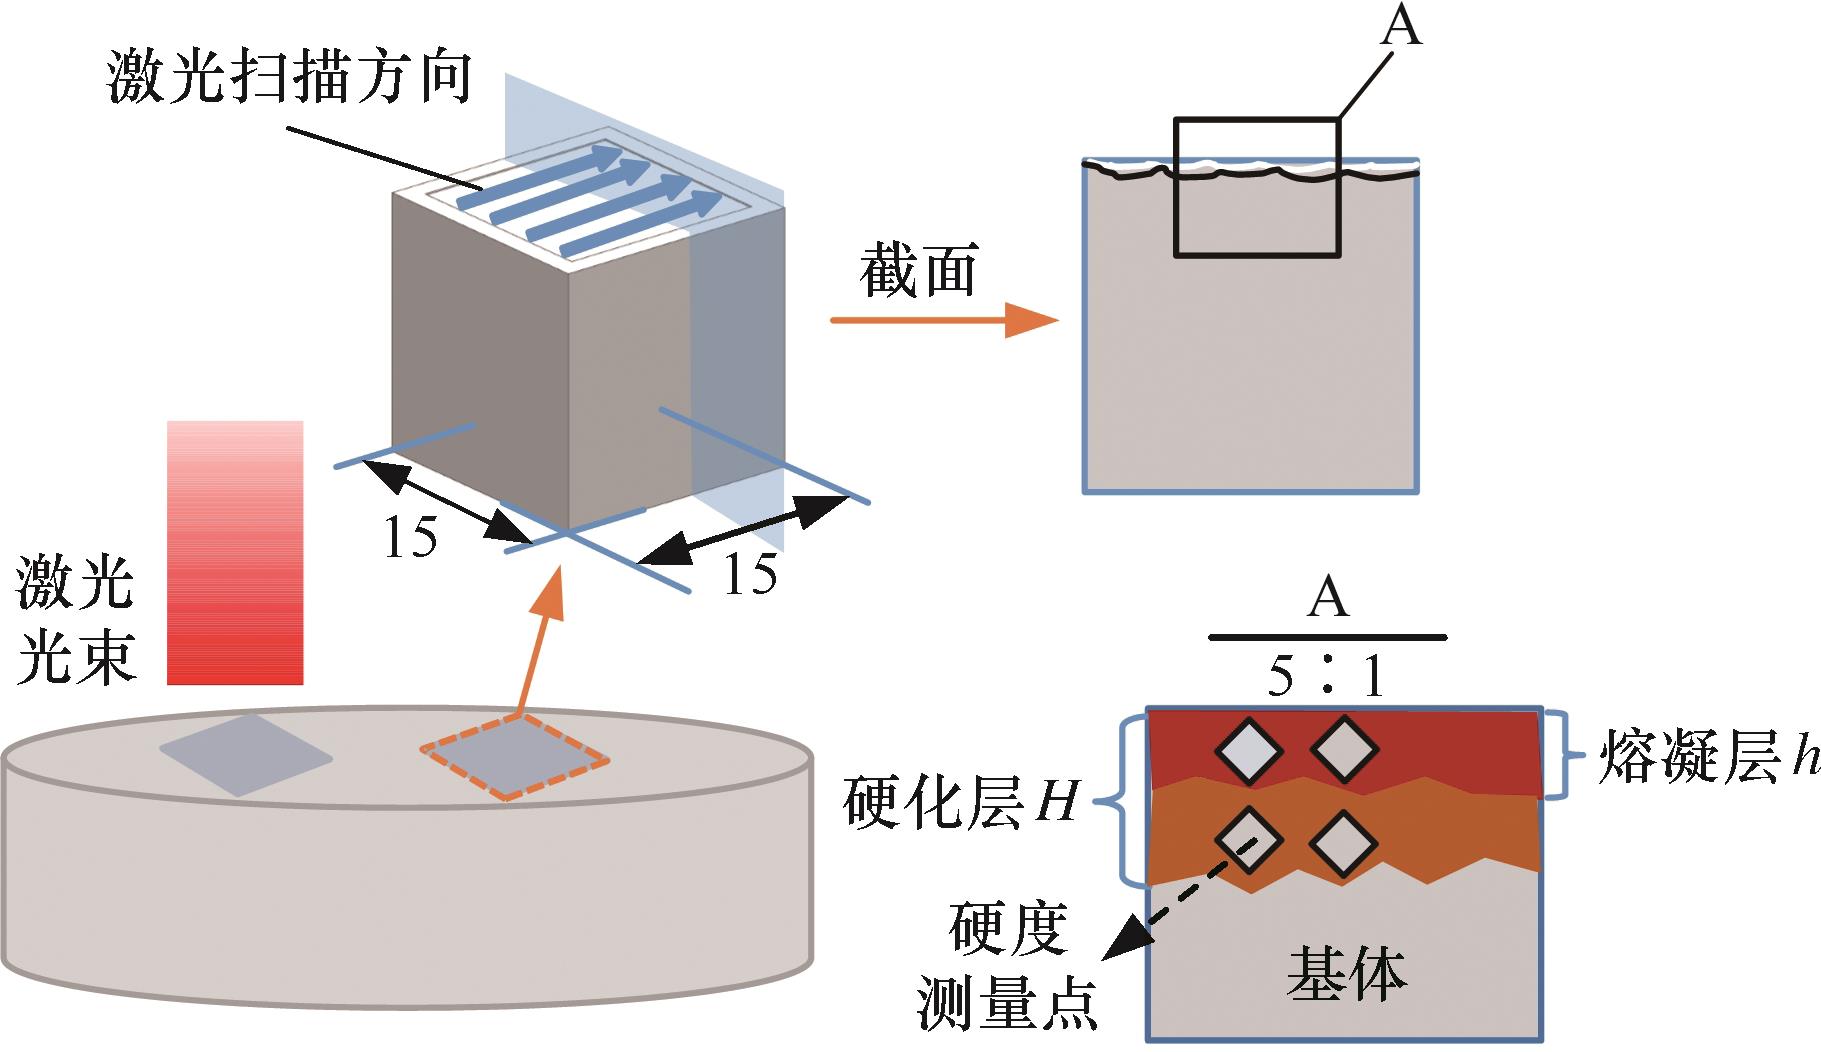
图4 激光硬化及测量
Fig.4 Laser hardening and measurement
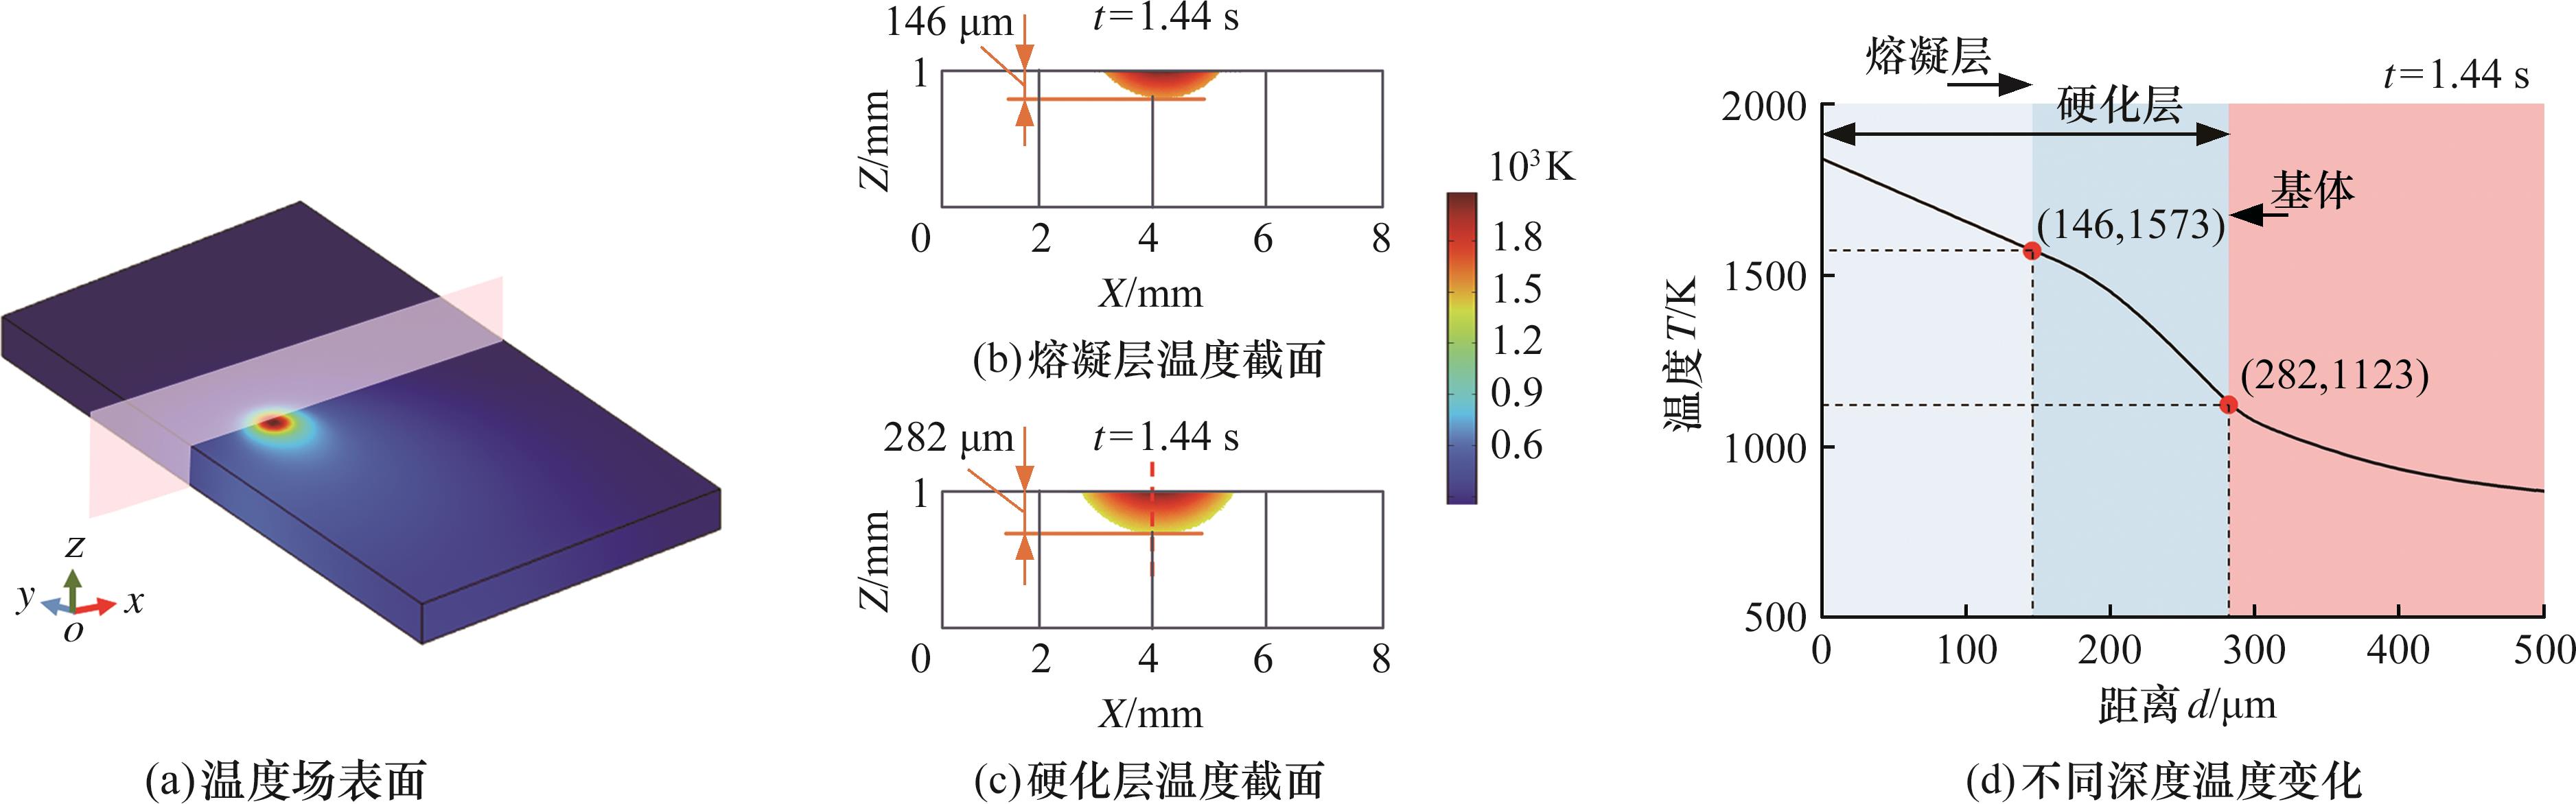
图5 有限元温度场模拟
Fig.5 Finite element temperature field simulation
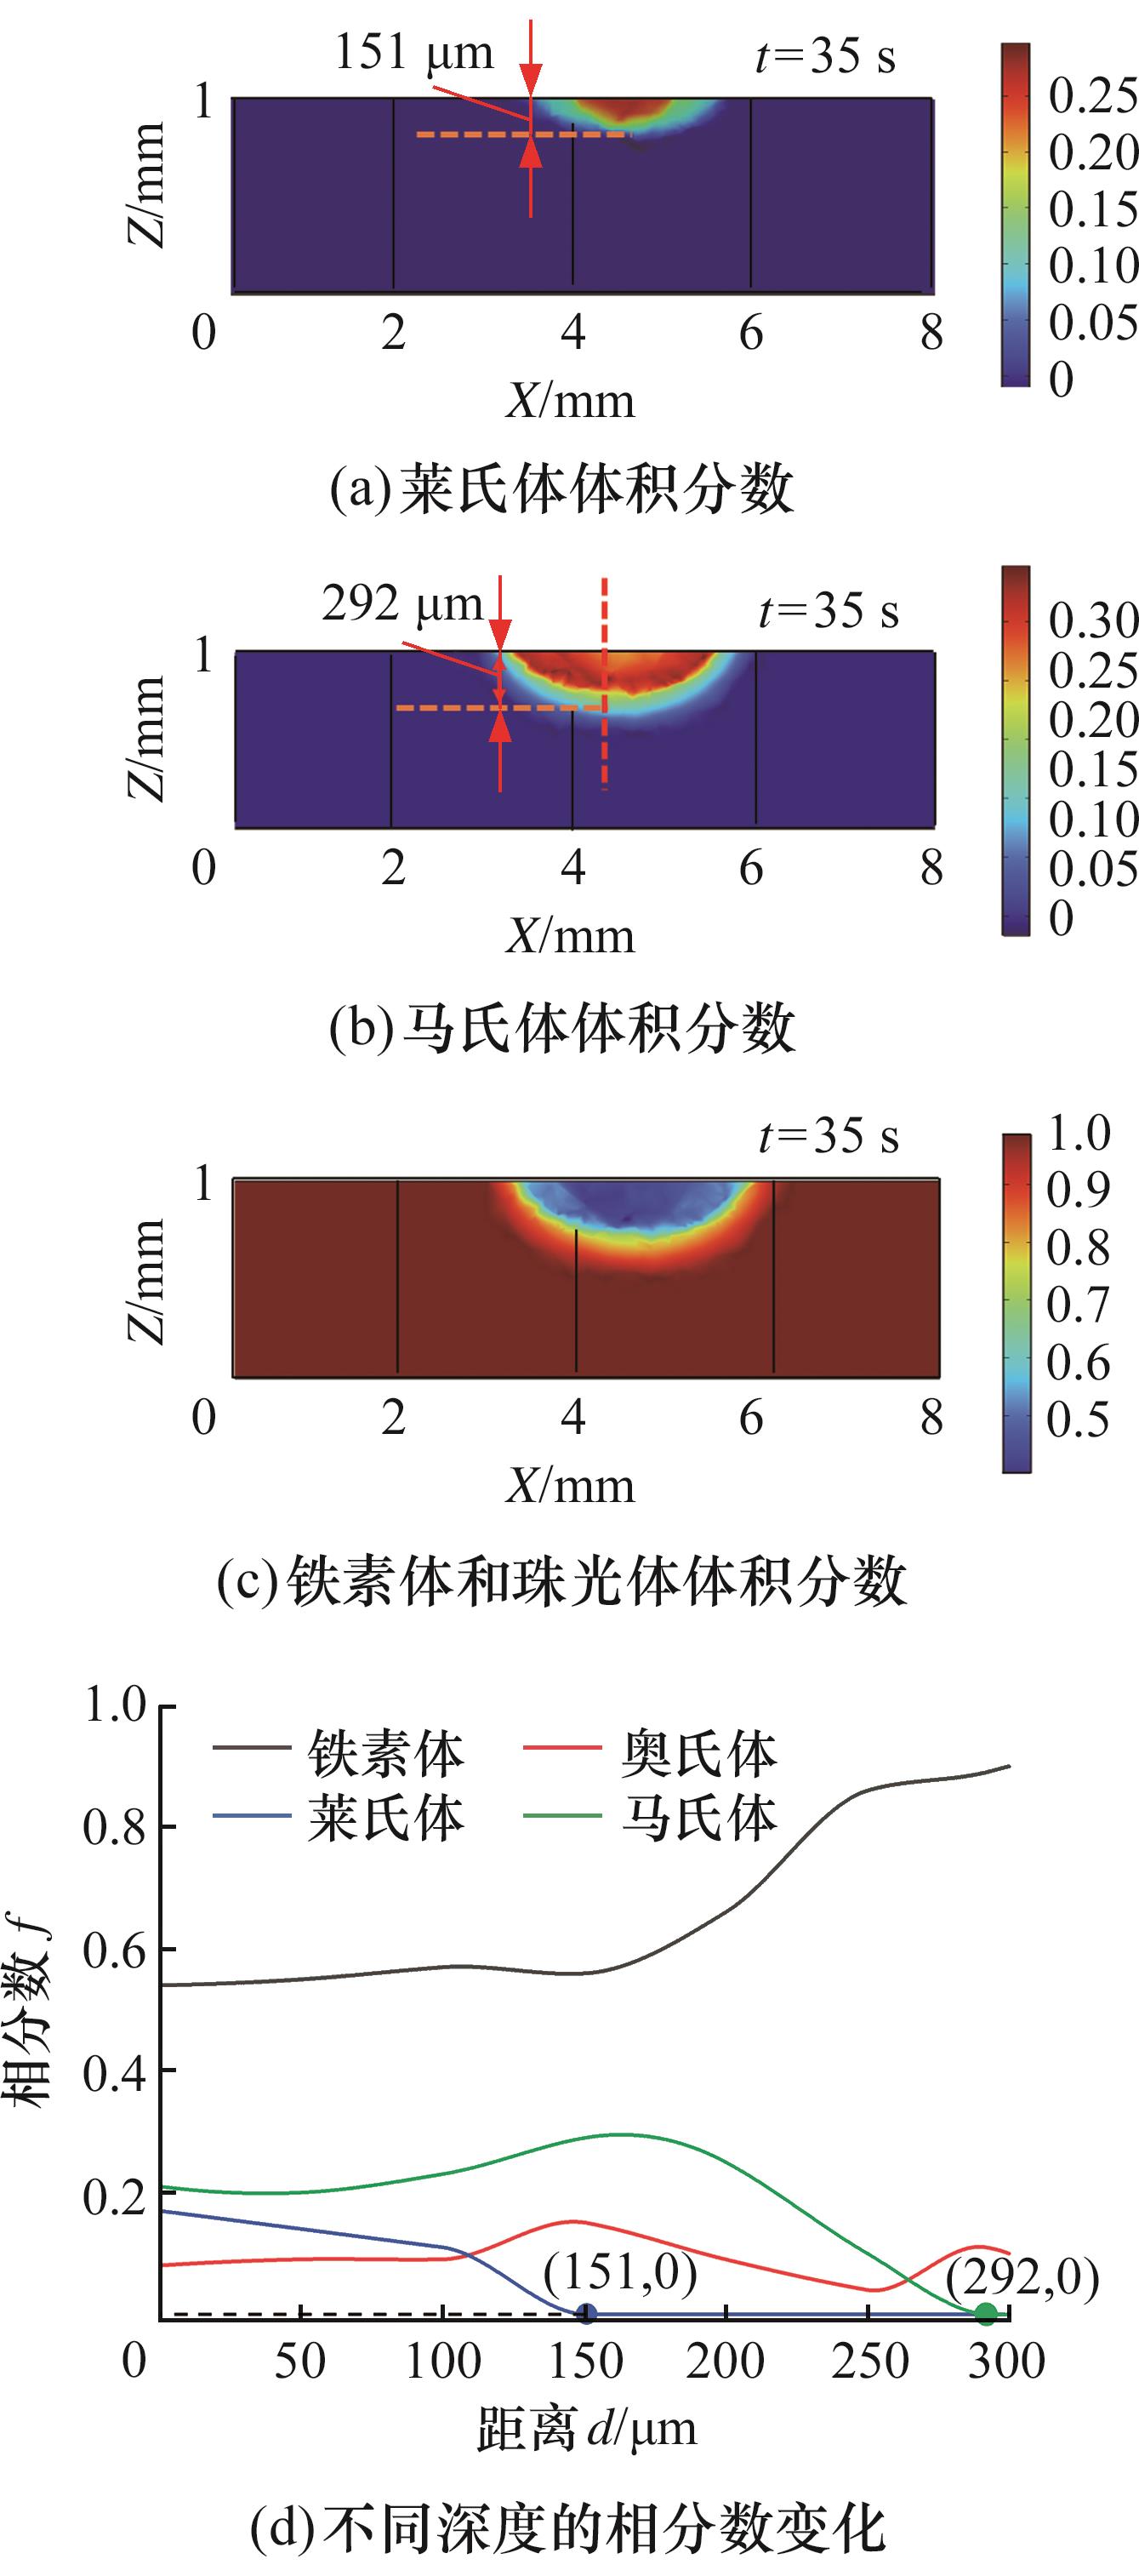
图6 相分数模拟结果
Fig.6 Simulated phase fraction results
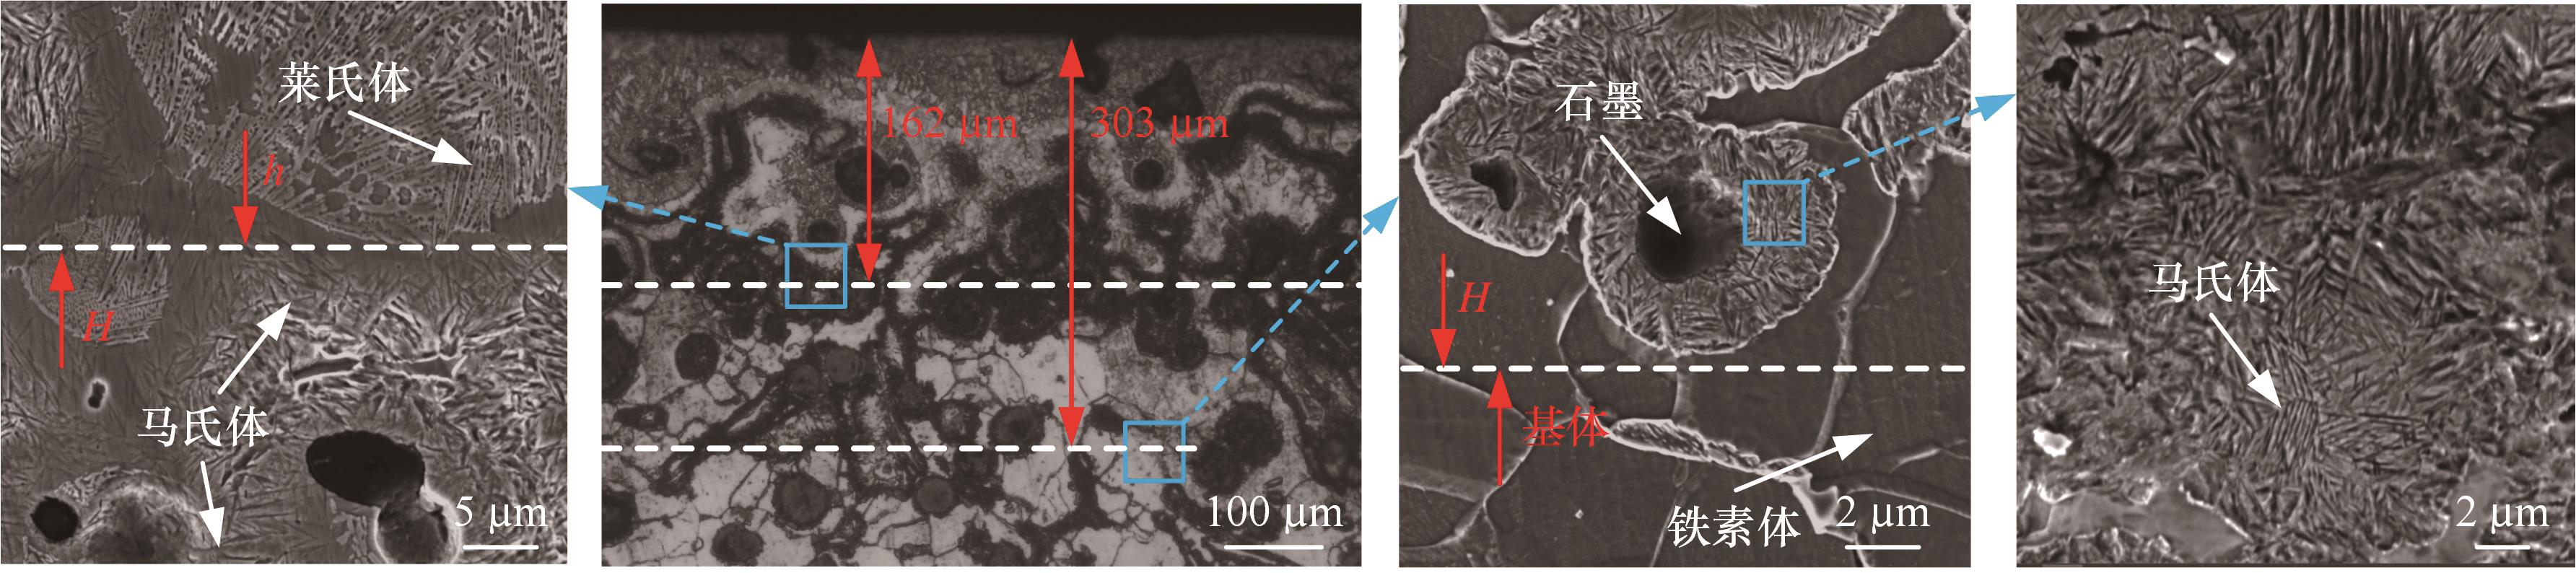
图7 激光硬化截面图
Fig.7 Cross-section diagram of laser hardening
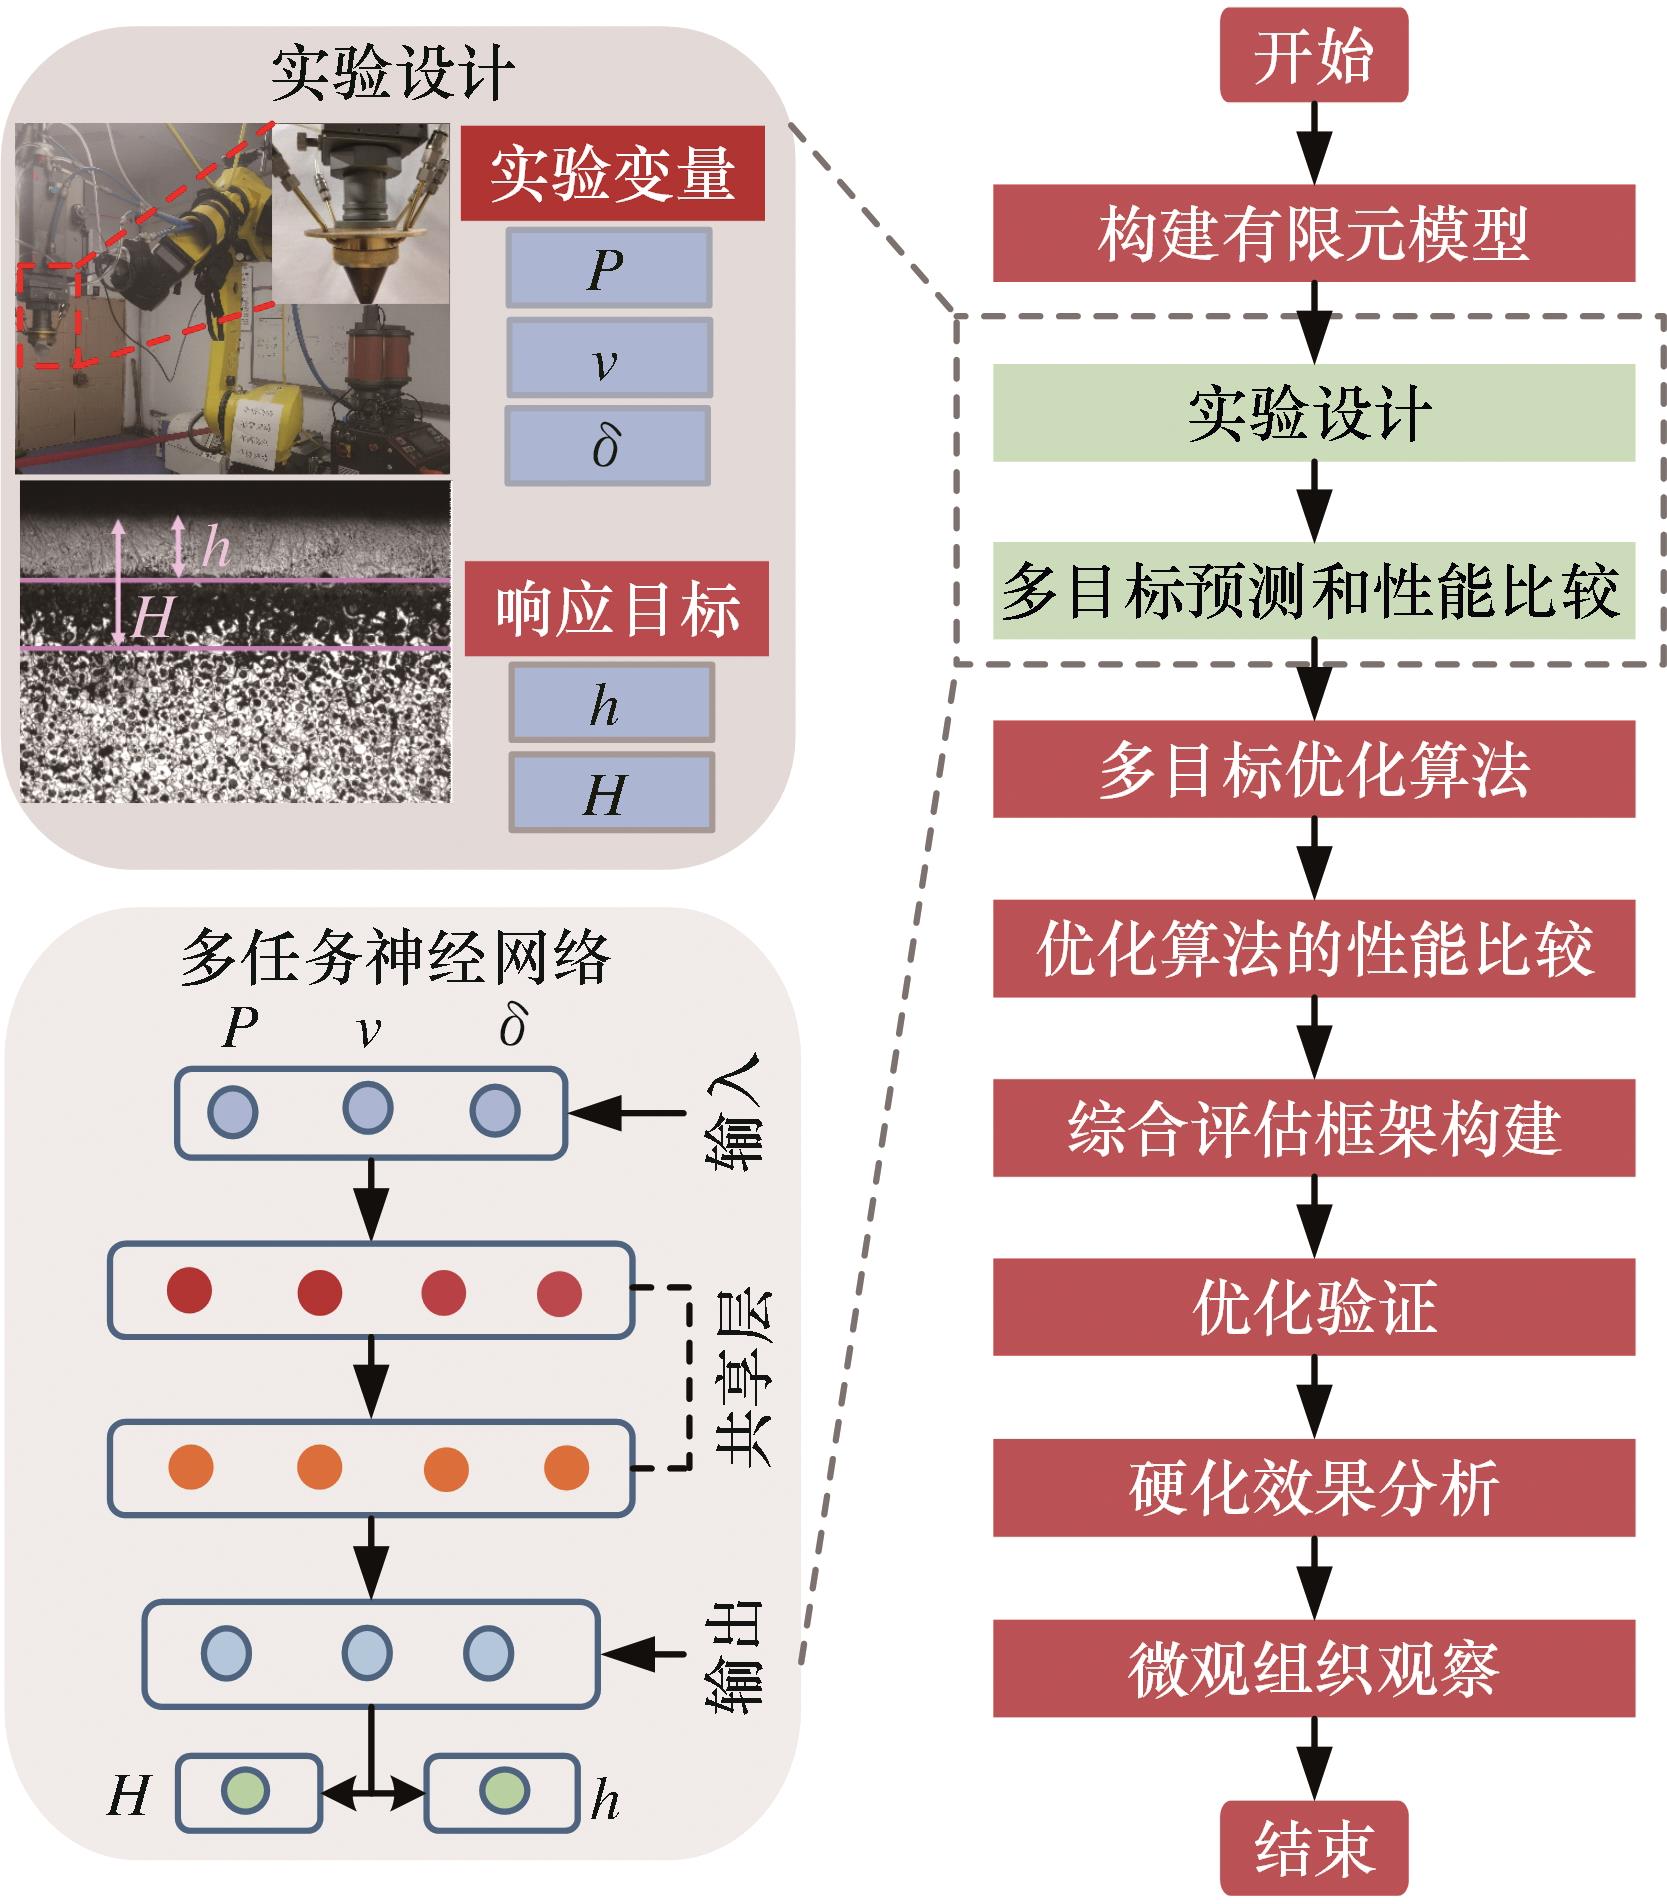
图8 优化分析流程
Fig.8 Optimization analysis flowchart
| 序号 | P/W | v/ (mm·s | δ/% | h/μm | H/μm |
|---|---|---|---|---|---|
| 1 | 345 | 12 | 70 | 410 | 550 |
| 2 | 364 | 5 | 63 | 520 | 680 |
| 3 | 116 | 13 | 68 | 0 | 0 |
| 4 | 458 | 8 | 90 | 540 | 700 |
| 5 | 443 | 10 | 76 | 520 | 680 |
| 6 | 233 | 7 | 84 | 140 | 270 |
| 7 | 326 | 6 | 81 | 445 | 600 |
| 8 | 213 | 14 | 75 | 140 | 290 |
| 9 | 111 | 13 | 71 | 0 | 0 |
| 10 | 413 | 13 | 66 | 485 | 630 |
| 11 | 302 | 9 | 86 | 380 | 510 |
| 12 | 262 | 9 | 73 | 290 | 420 |
| 13 | 388 | 10 | 89 | 480 | 620 |
| 14 | 316 | 9 | 61 | 390 | 540 |
| 15 | 138 | 6 | 64 | 0 | 105 |
| 16 | 477 | 14 | 62 | 515 | 670 |
| 17 | 487 | 11 | 84 | 530 | 685 |
| 18 | 185 | 7 | 86 | 20 | 185 |
| 19 | 251 | 11 | 80 | 255 | 385 |
| 20 | 149 | 15 | 66 | 0 | 80 |
| 21 | 285 | 11 | 74 | 325 | 450 |
| 22 | 206 | 10 | 78 | 170 | 305 |
| 23 | 394 | 6 | 69 | 525 | 710 |
| 24 | 434 | 14 | 82 | 480 | 610 |
| 25 | 177 | 7 | 78 | 105 | 260 |
表3 实验方案及模拟结果
Tab.3 Experimental program and simulation results
| 序号 | P/W | v/ (mm·s | δ/% | h/μm | H/μm |
|---|---|---|---|---|---|
| 1 | 345 | 12 | 70 | 410 | 550 |
| 2 | 364 | 5 | 63 | 520 | 680 |
| 3 | 116 | 13 | 68 | 0 | 0 |
| 4 | 458 | 8 | 90 | 540 | 700 |
| 5 | 443 | 10 | 76 | 520 | 680 |
| 6 | 233 | 7 | 84 | 140 | 270 |
| 7 | 326 | 6 | 81 | 445 | 600 |
| 8 | 213 | 14 | 75 | 140 | 290 |
| 9 | 111 | 13 | 71 | 0 | 0 |
| 10 | 413 | 13 | 66 | 485 | 630 |
| 11 | 302 | 9 | 86 | 380 | 510 |
| 12 | 262 | 9 | 73 | 290 | 420 |
| 13 | 388 | 10 | 89 | 480 | 620 |
| 14 | 316 | 9 | 61 | 390 | 540 |
| 15 | 138 | 6 | 64 | 0 | 105 |
| 16 | 477 | 14 | 62 | 515 | 670 |
| 17 | 487 | 11 | 84 | 530 | 685 |
| 18 | 185 | 7 | 86 | 20 | 185 |
| 19 | 251 | 11 | 80 | 255 | 385 |
| 20 | 149 | 15 | 66 | 0 | 80 |
| 21 | 285 | 11 | 74 | 325 | 450 |
| 22 | 206 | 10 | 78 | 170 | 305 |
| 23 | 394 | 6 | 69 | 525 | 710 |
| 24 | 434 | 14 | 82 | 480 | 610 |
| 25 | 177 | 7 | 78 | 105 | 260 |
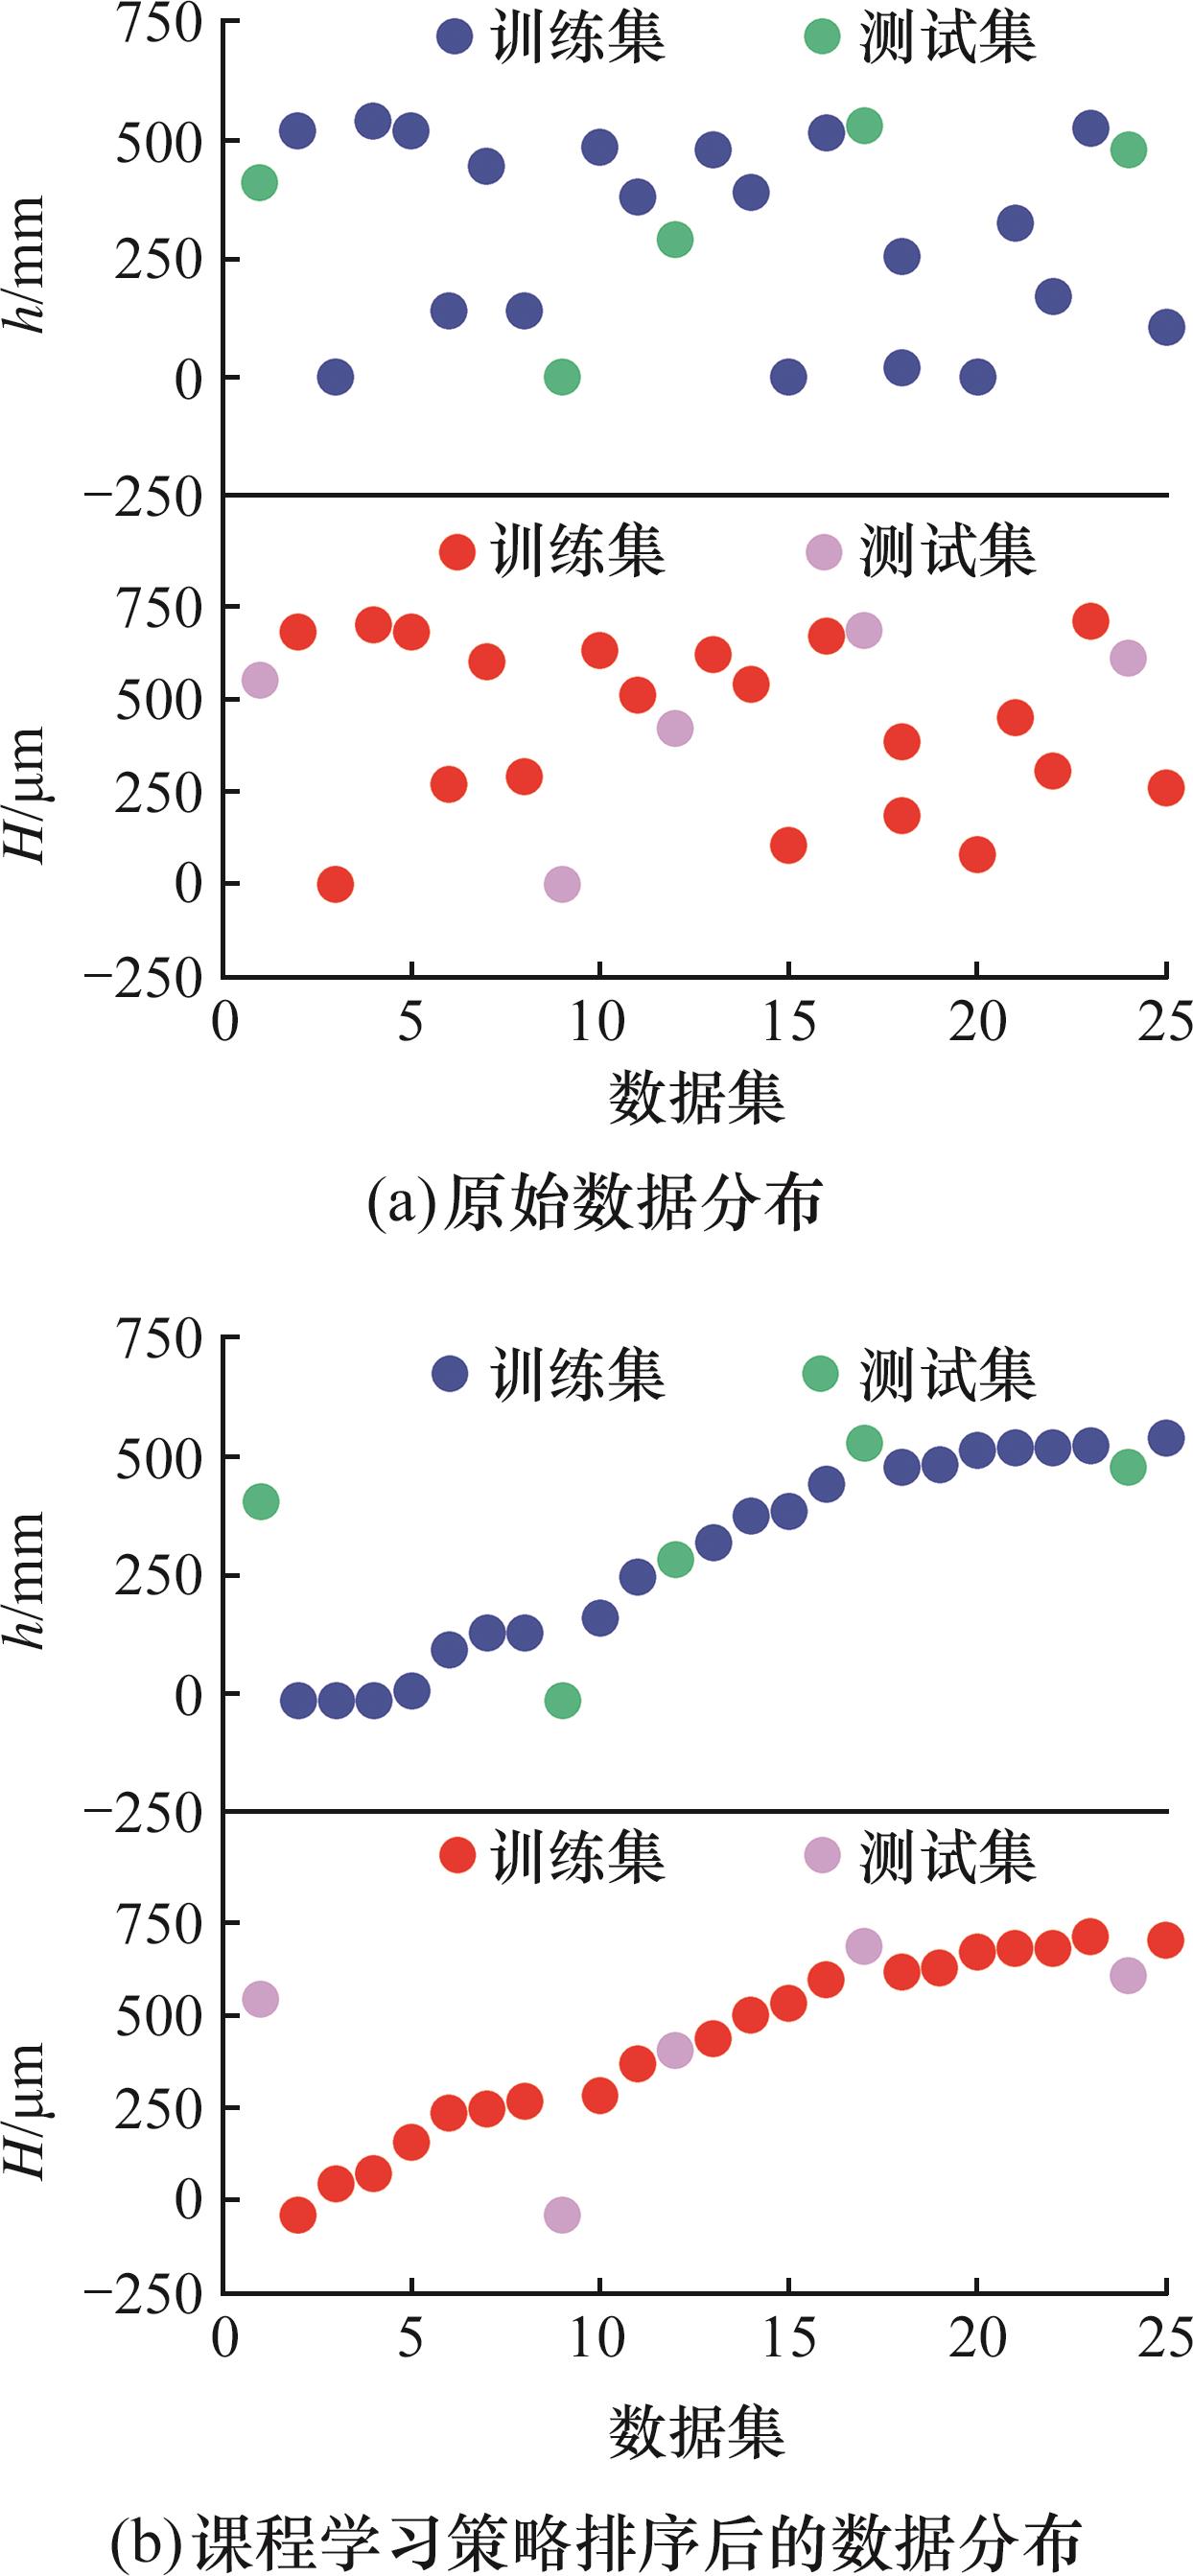
图9 原始数据和课程学习排序后的数据分布
Fig.9 Distribution of raw data and data after curriculum learning sorting
| 目标 | RF | XGBOOST | BPNN | MTNN | BO-MTNN | ||||||||||
|---|---|---|---|---|---|---|---|---|---|---|---|---|---|---|---|
| R2 | eMA | eRMS | R2 | eMA | eRMS | R2 | eMA | eRMS | R2 | eMA | eRMS | R2 | eMA | eRMS | |
| h | 0.793 | 67.83 | 85.96 | 0.887 | 56.23 | 63.44 | 0.992 | 11.54 | 13.54 | 0.969 | 8.25 | 43.11 | 0.993 | 5.33 | 6.35 |
| H | 0.797 | 82.27 | 109.23 | 0.864 | 69.79 | 89.43 | 0.993 | 15.52 | 19.74 | 0.968 | 22.9 | 67.48 | 0.997 | 14.19 | 19.36 |
表4 预测模型性能对比
Tab.4 Comparison of model accuracy
| 目标 | RF | XGBOOST | BPNN | MTNN | BO-MTNN | ||||||||||
|---|---|---|---|---|---|---|---|---|---|---|---|---|---|---|---|
| R2 | eMA | eRMS | R2 | eMA | eRMS | R2 | eMA | eRMS | R2 | eMA | eRMS | R2 | eMA | eRMS | |
| h | 0.793 | 67.83 | 85.96 | 0.887 | 56.23 | 63.44 | 0.992 | 11.54 | 13.54 | 0.969 | 8.25 | 43.11 | 0.993 | 5.33 | 6.35 |
| H | 0.797 | 82.27 | 109.23 | 0.864 | 69.79 | 89.43 | 0.993 | 15.52 | 19.74 | 0.968 | 22.9 | 67.48 | 0.997 | 14.19 | 19.36 |
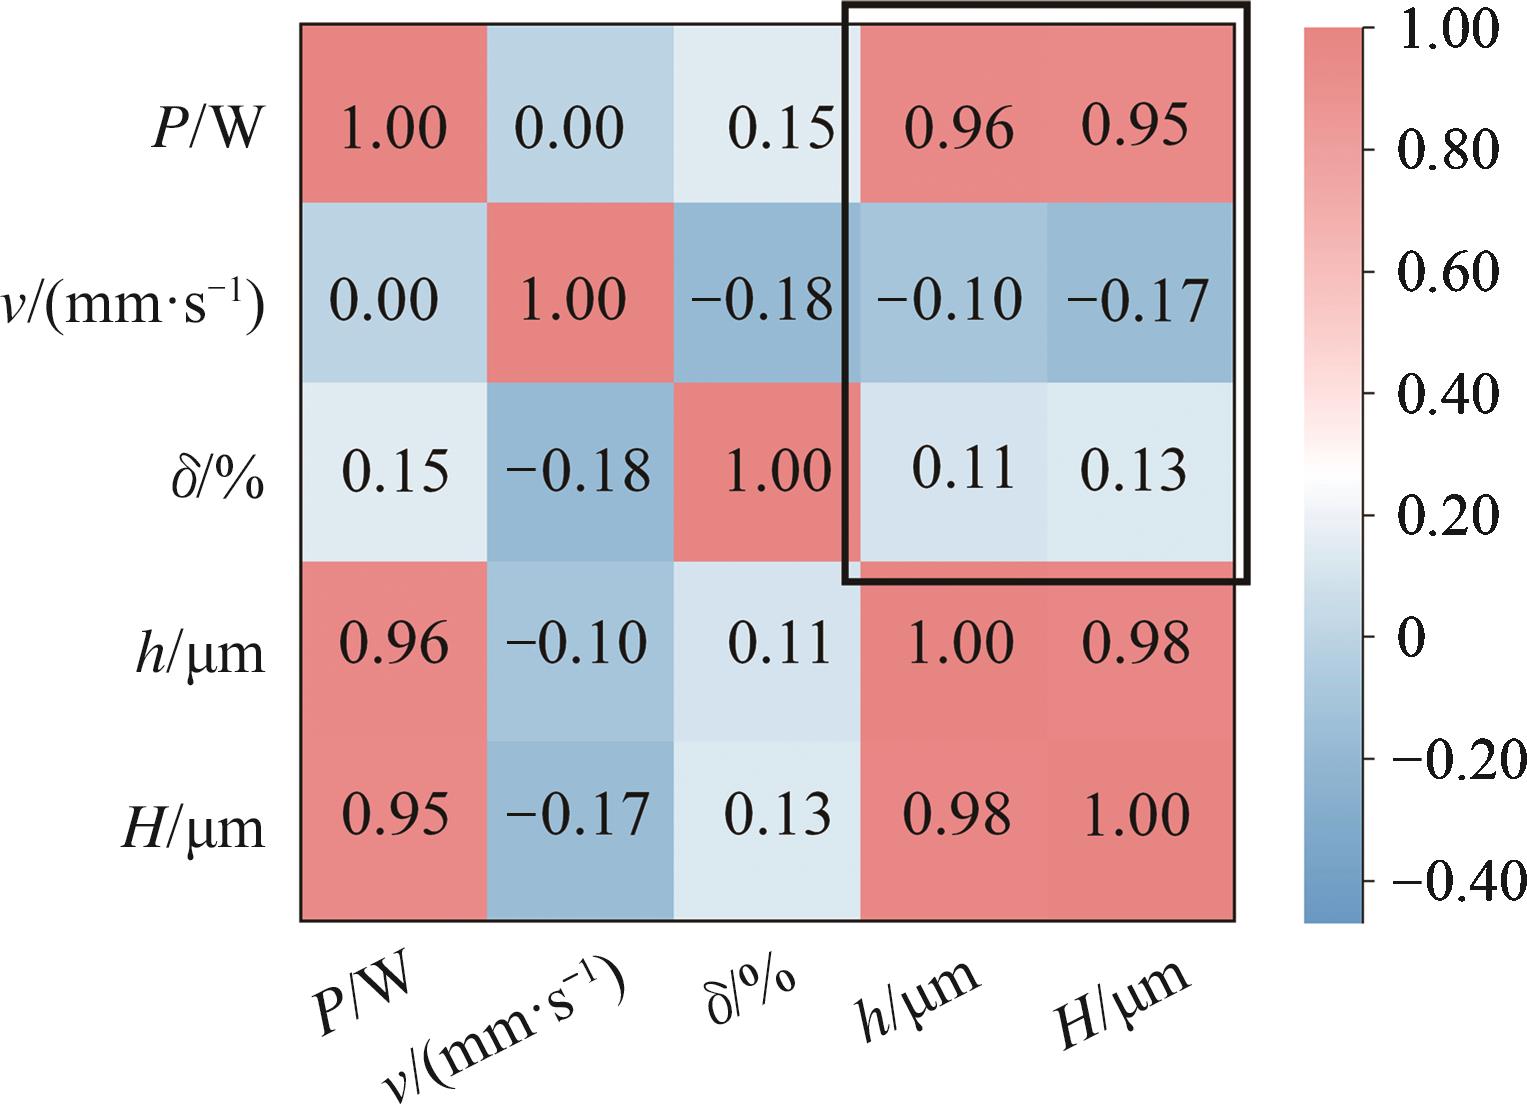
图10 参数变量间的皮尔逊相关系数热图
Fig.10 Pearson correlation matrix of the input variables
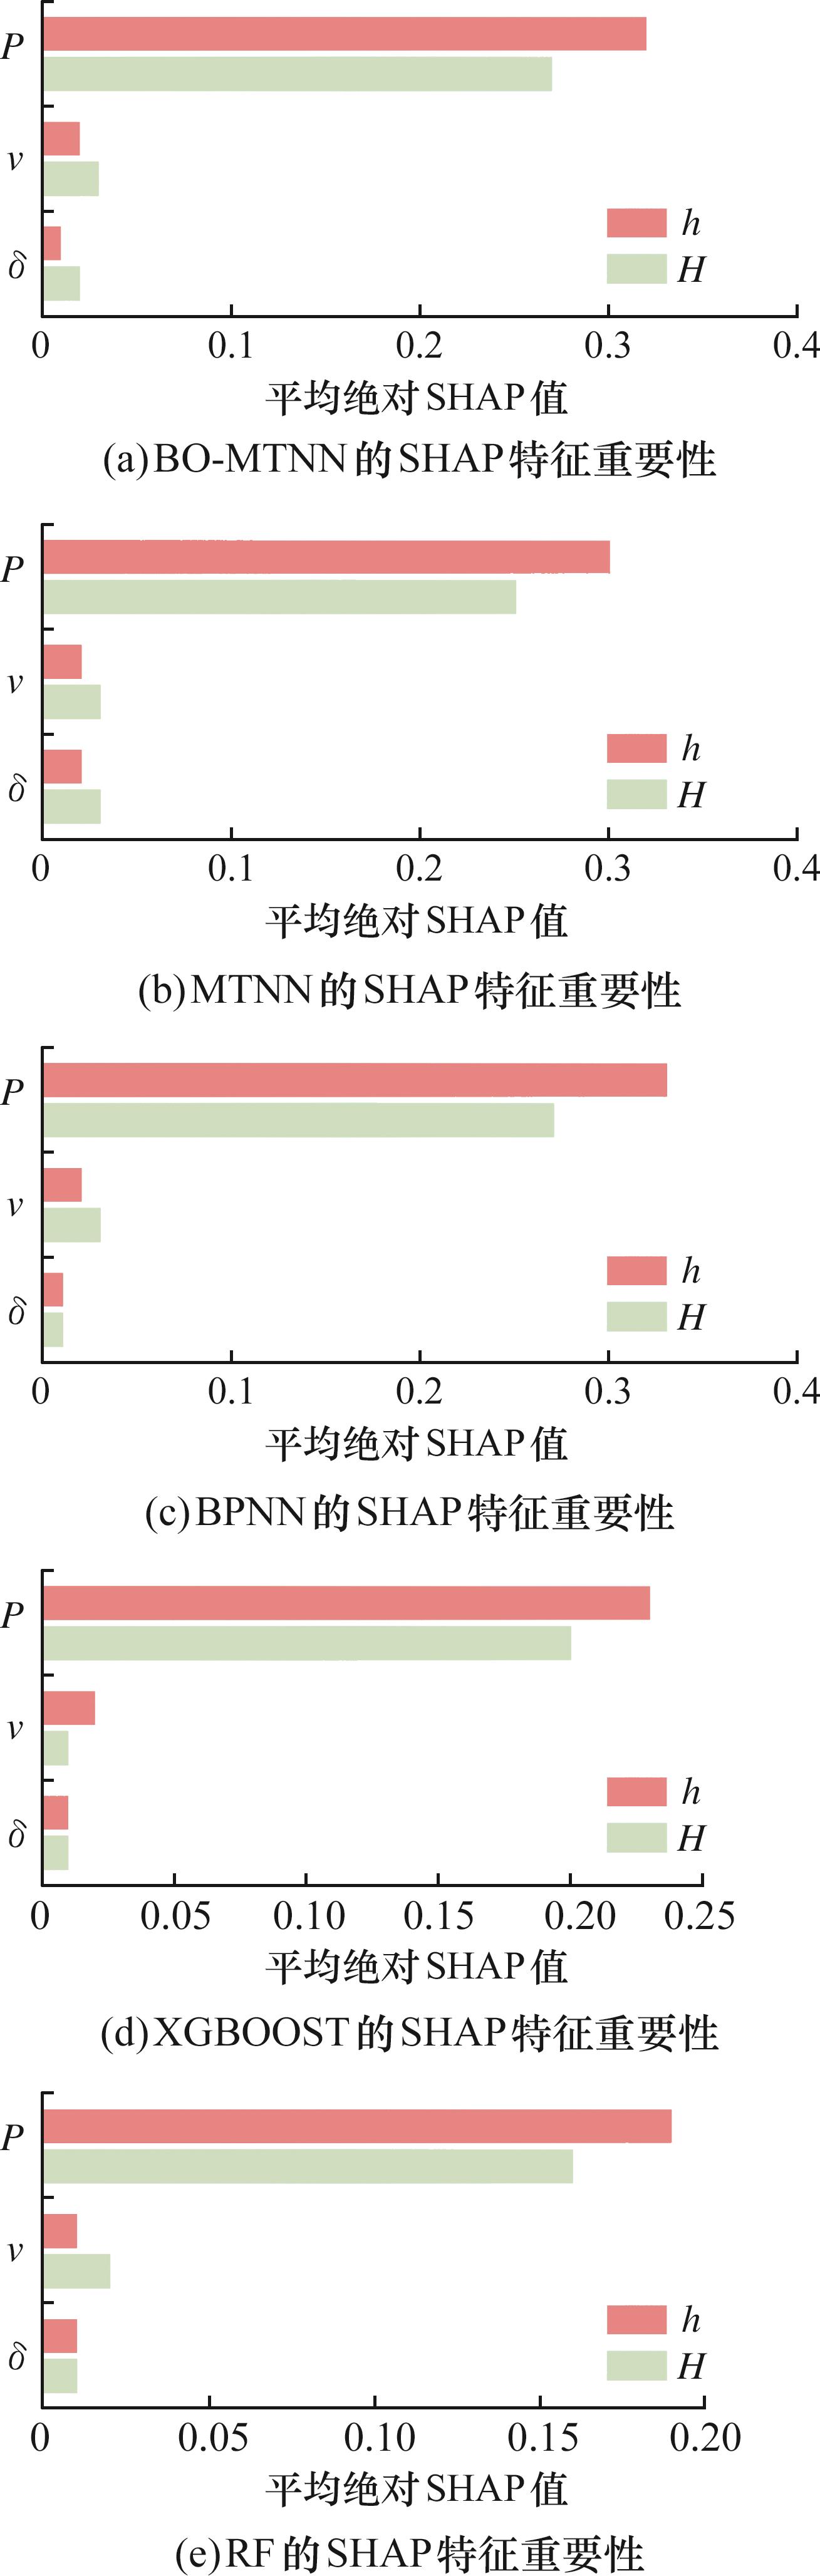
图11 SHAP特征重要性评分排序的对比图
Fig.11 Comparison of SHAP feature importance scores
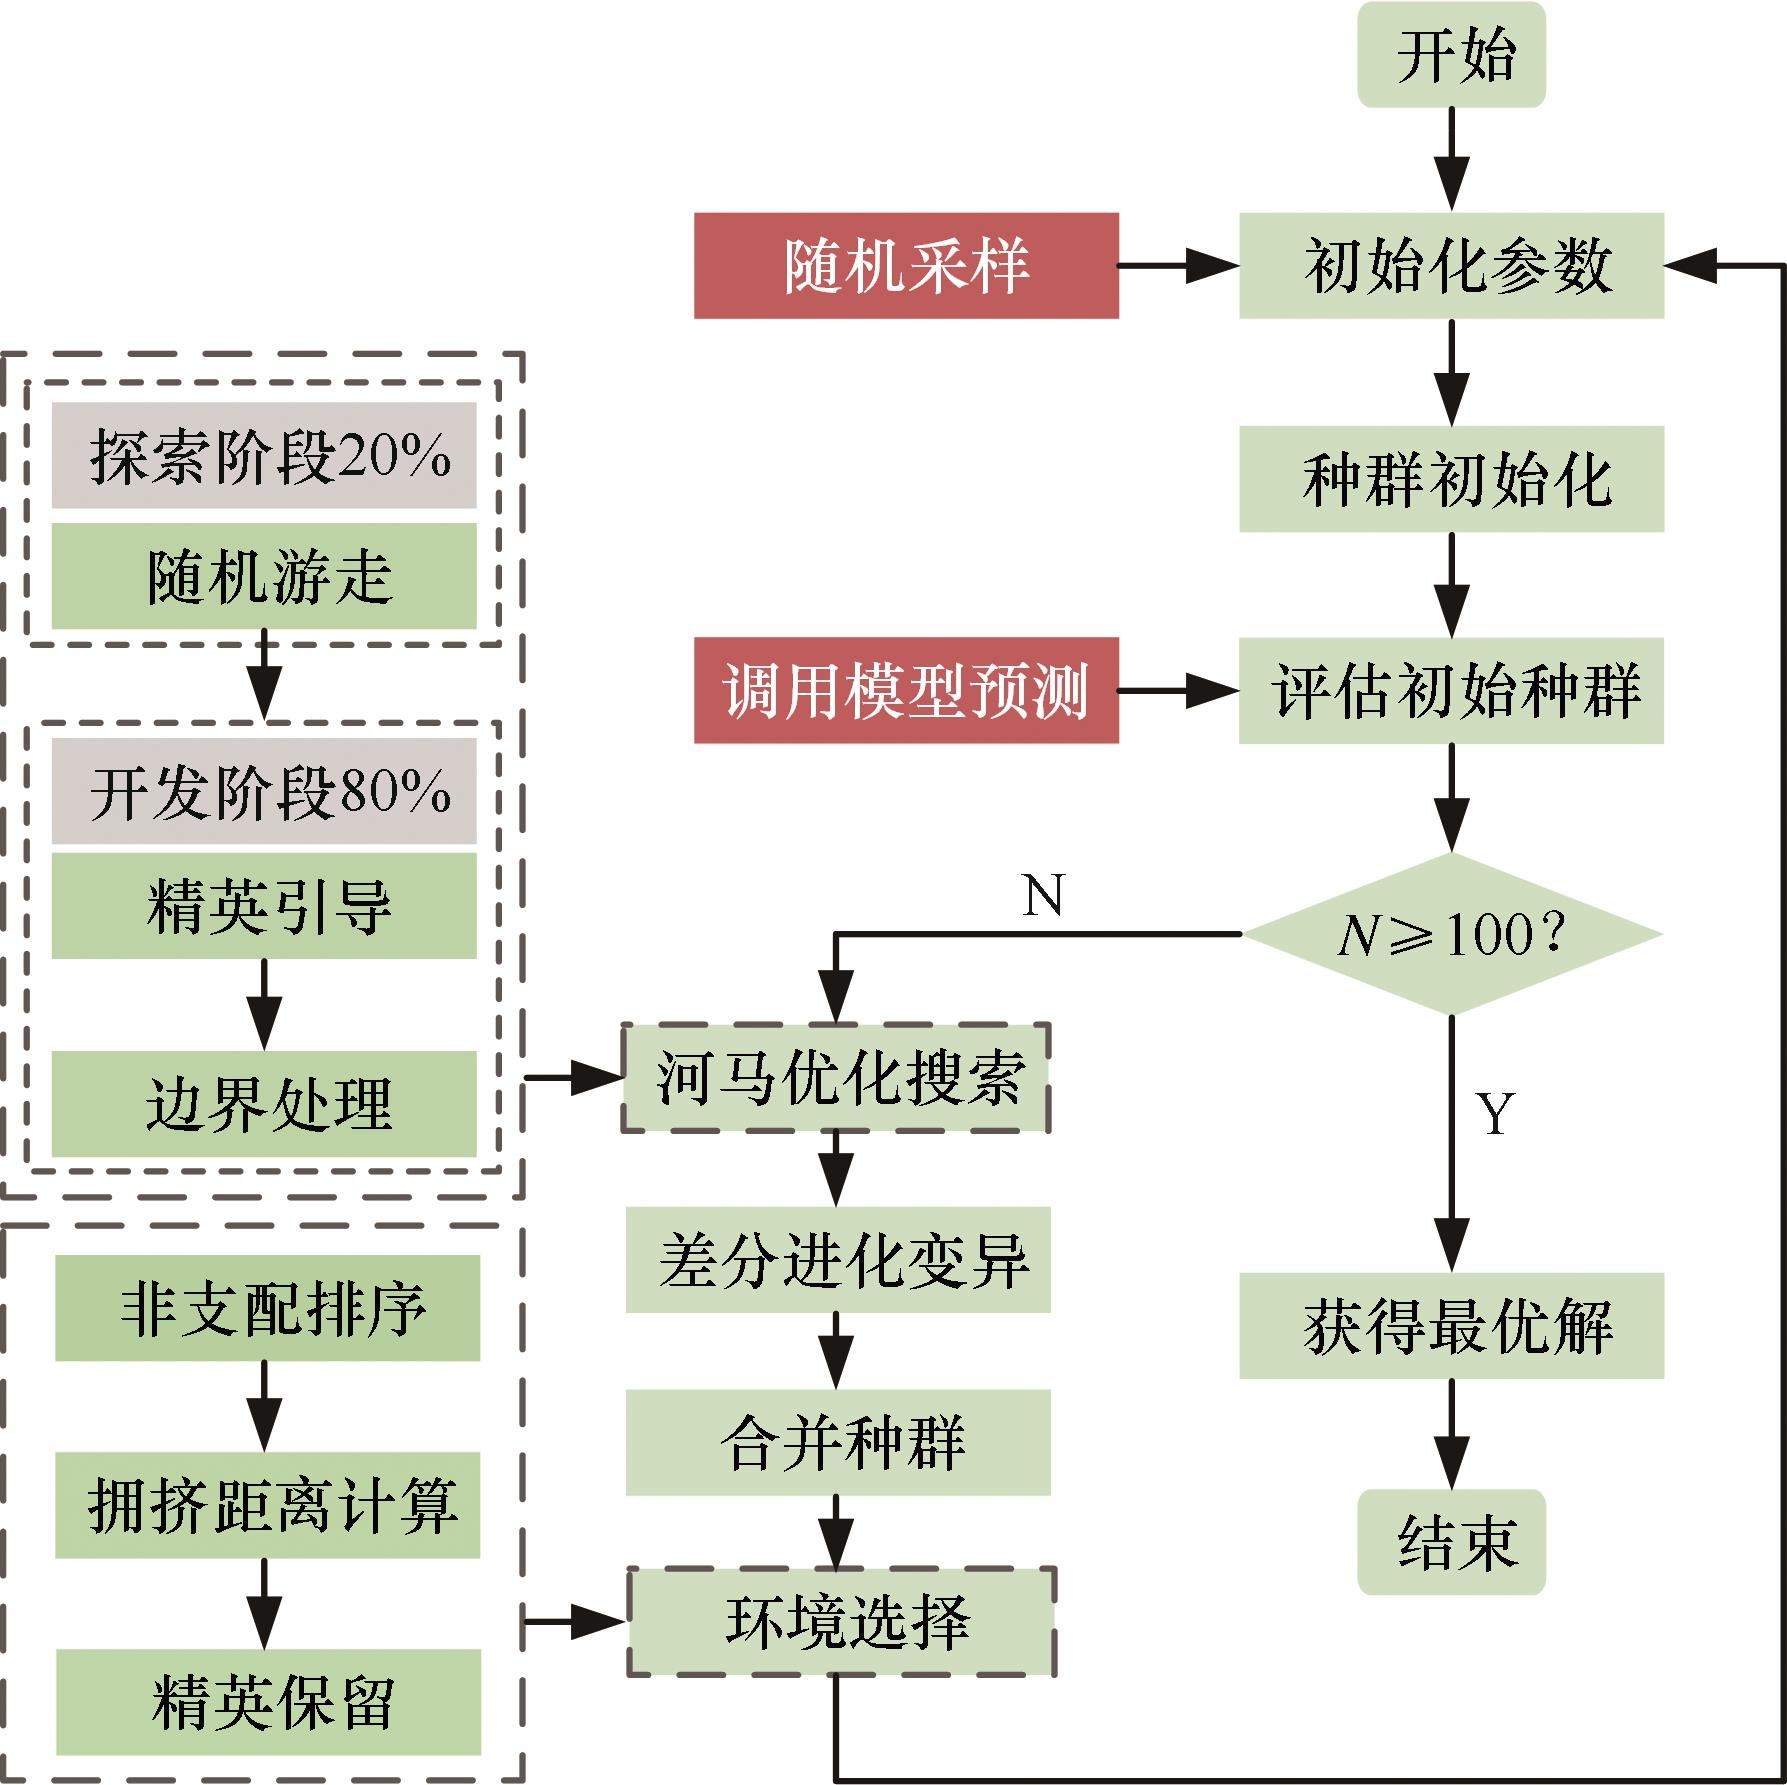
图12 MOHOA算法流程图
Fig.12 Flowchart of the MOHOA algorithm
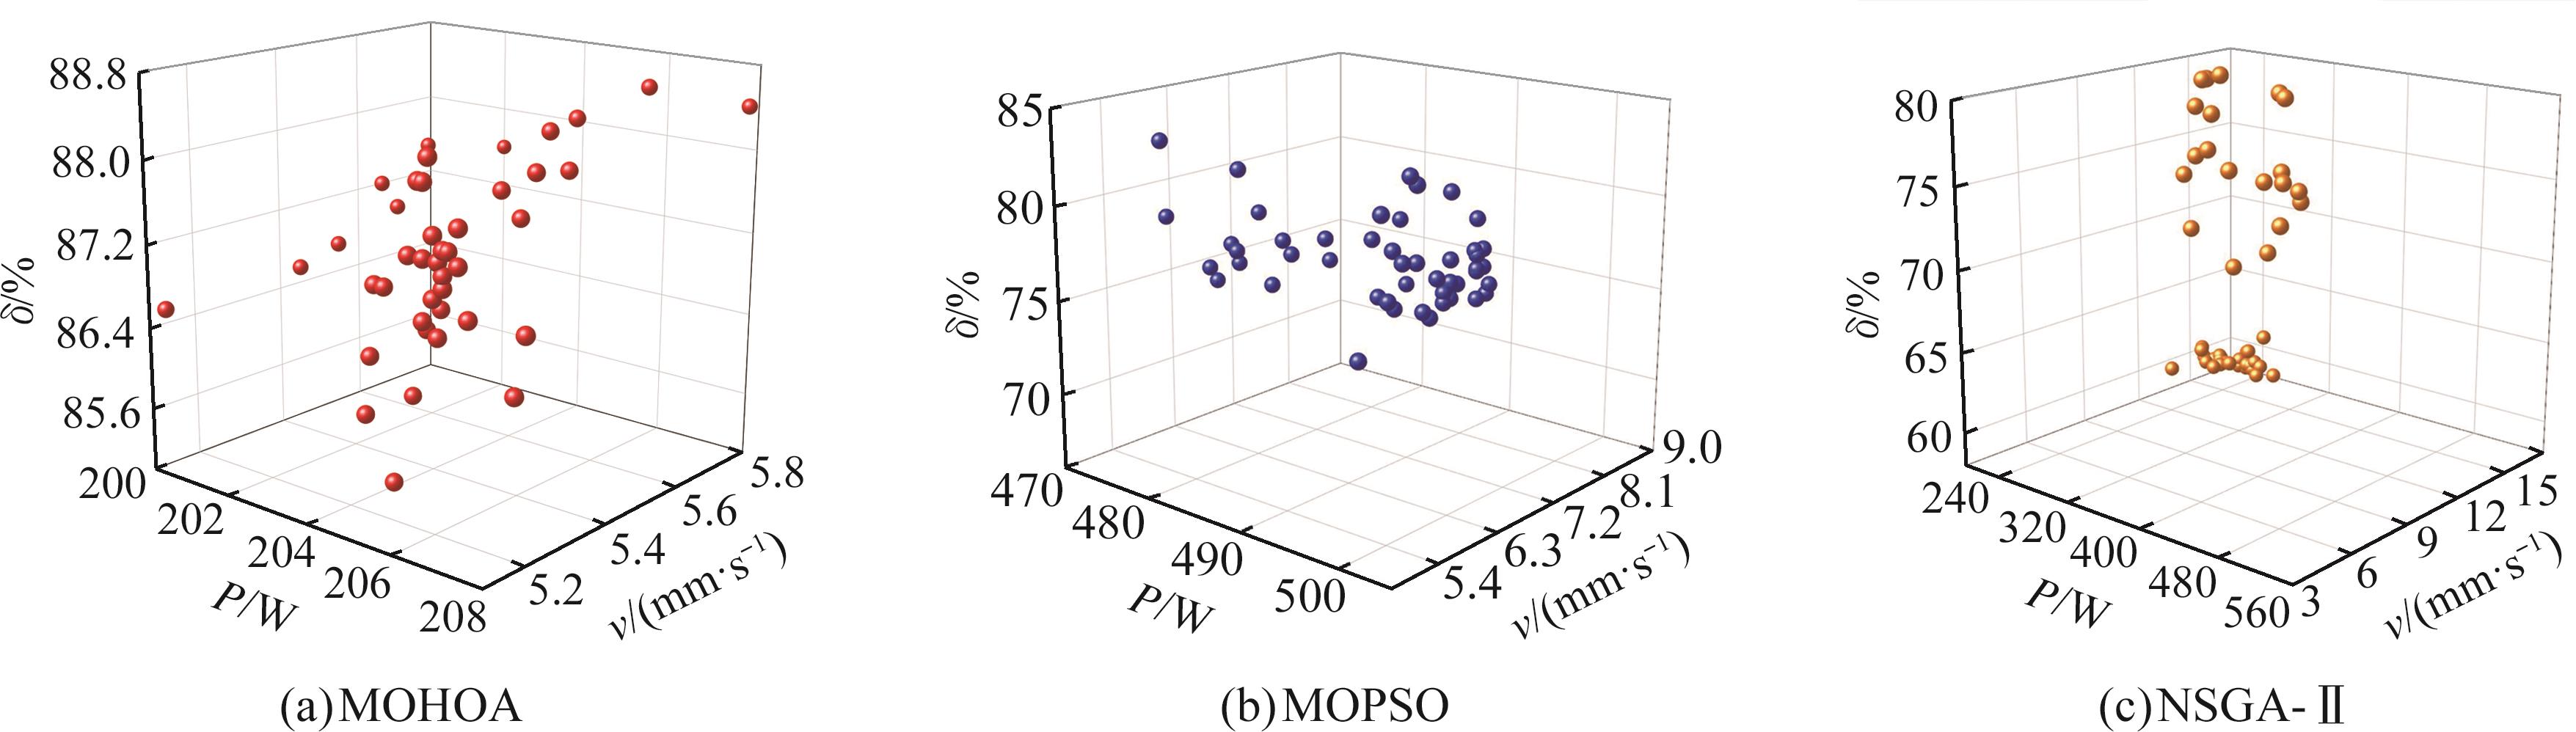
图13 各优化算法所得帕累托解集
Fig.13 The set of Pareto solutions obtained by each optimization algorithm
| 评价指标 | MOHOA | MOPSO | NSGA-II |
|---|---|---|---|
| HV | 3.71×10⁵ | 2.14×10⁵ | 2.57×10⁵ |
| IGD | 4.24 | 5.39 | 4.63 |
表5 算法性能对比
Tab.5 Algorithm performance comparison
| 评价指标 | MOHOA | MOPSO | NSGA-II |
|---|---|---|---|
| HV | 3.71×10⁵ | 2.14×10⁵ | 2.57×10⁵ |
| IGD | 4.24 | 5.39 | 4.63 |
| 序号 | P/W | v/(mm·s | δ/% | H/μm | h/μm | Gi |
|---|---|---|---|---|---|---|
| 1 | 201.8 | 5.0 | 86.9 | 245.9 | 73.5 | 0.62 |
| 2 | 207.6 | 5.0 | 88.5 | 243.2 | 72.5 | 0.61 |
| 3 | 207.6 | 5.1 | 88.5 | 243 | 72.3 | 0.59 |
| 4 | 206.6 | 5.3 | 87.6 | 250.3 | 79.3 | 0.56 |
| 5 | 208 | 5.4 | 82.8 | 304.5 | 135.8 | 0.54 |
表6 综合评估排名前5组解
Tab.6 Top 5 groups of solutions ranked by comprehensive evaluation
| 序号 | P/W | v/(mm·s | δ/% | H/μm | h/μm | Gi |
|---|---|---|---|---|---|---|
| 1 | 201.8 | 5.0 | 86.9 | 245.9 | 73.5 | 0.62 |
| 2 | 207.6 | 5.0 | 88.5 | 243.2 | 72.5 | 0.61 |
| 3 | 207.6 | 5.1 | 88.5 | 243 | 72.3 | 0.59 |
| 4 | 206.6 | 5.3 | 87.6 | 250.3 | 79.3 | 0.56 |
| 5 | 208 | 5.4 | 82.8 | 304.5 | 135.8 | 0.54 |
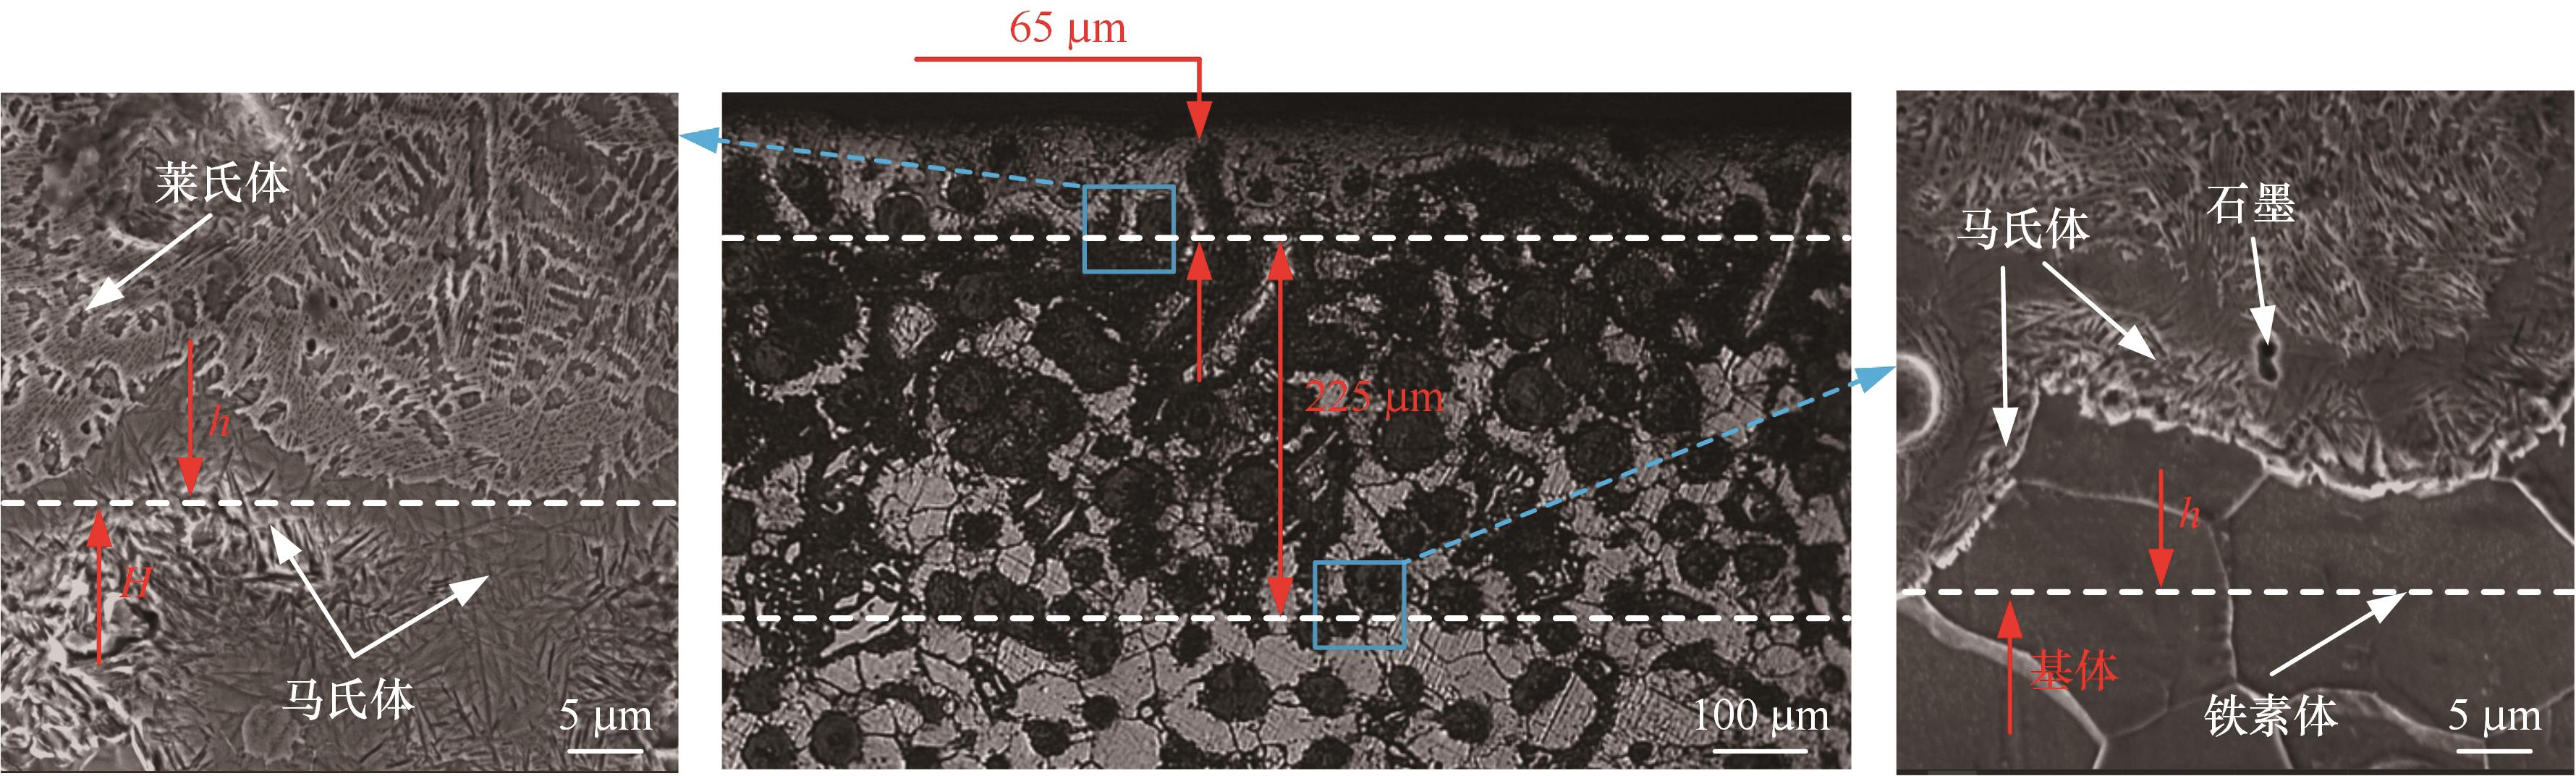
图15 硬化实验截面
Fig.15 Hardened specimen cross-section
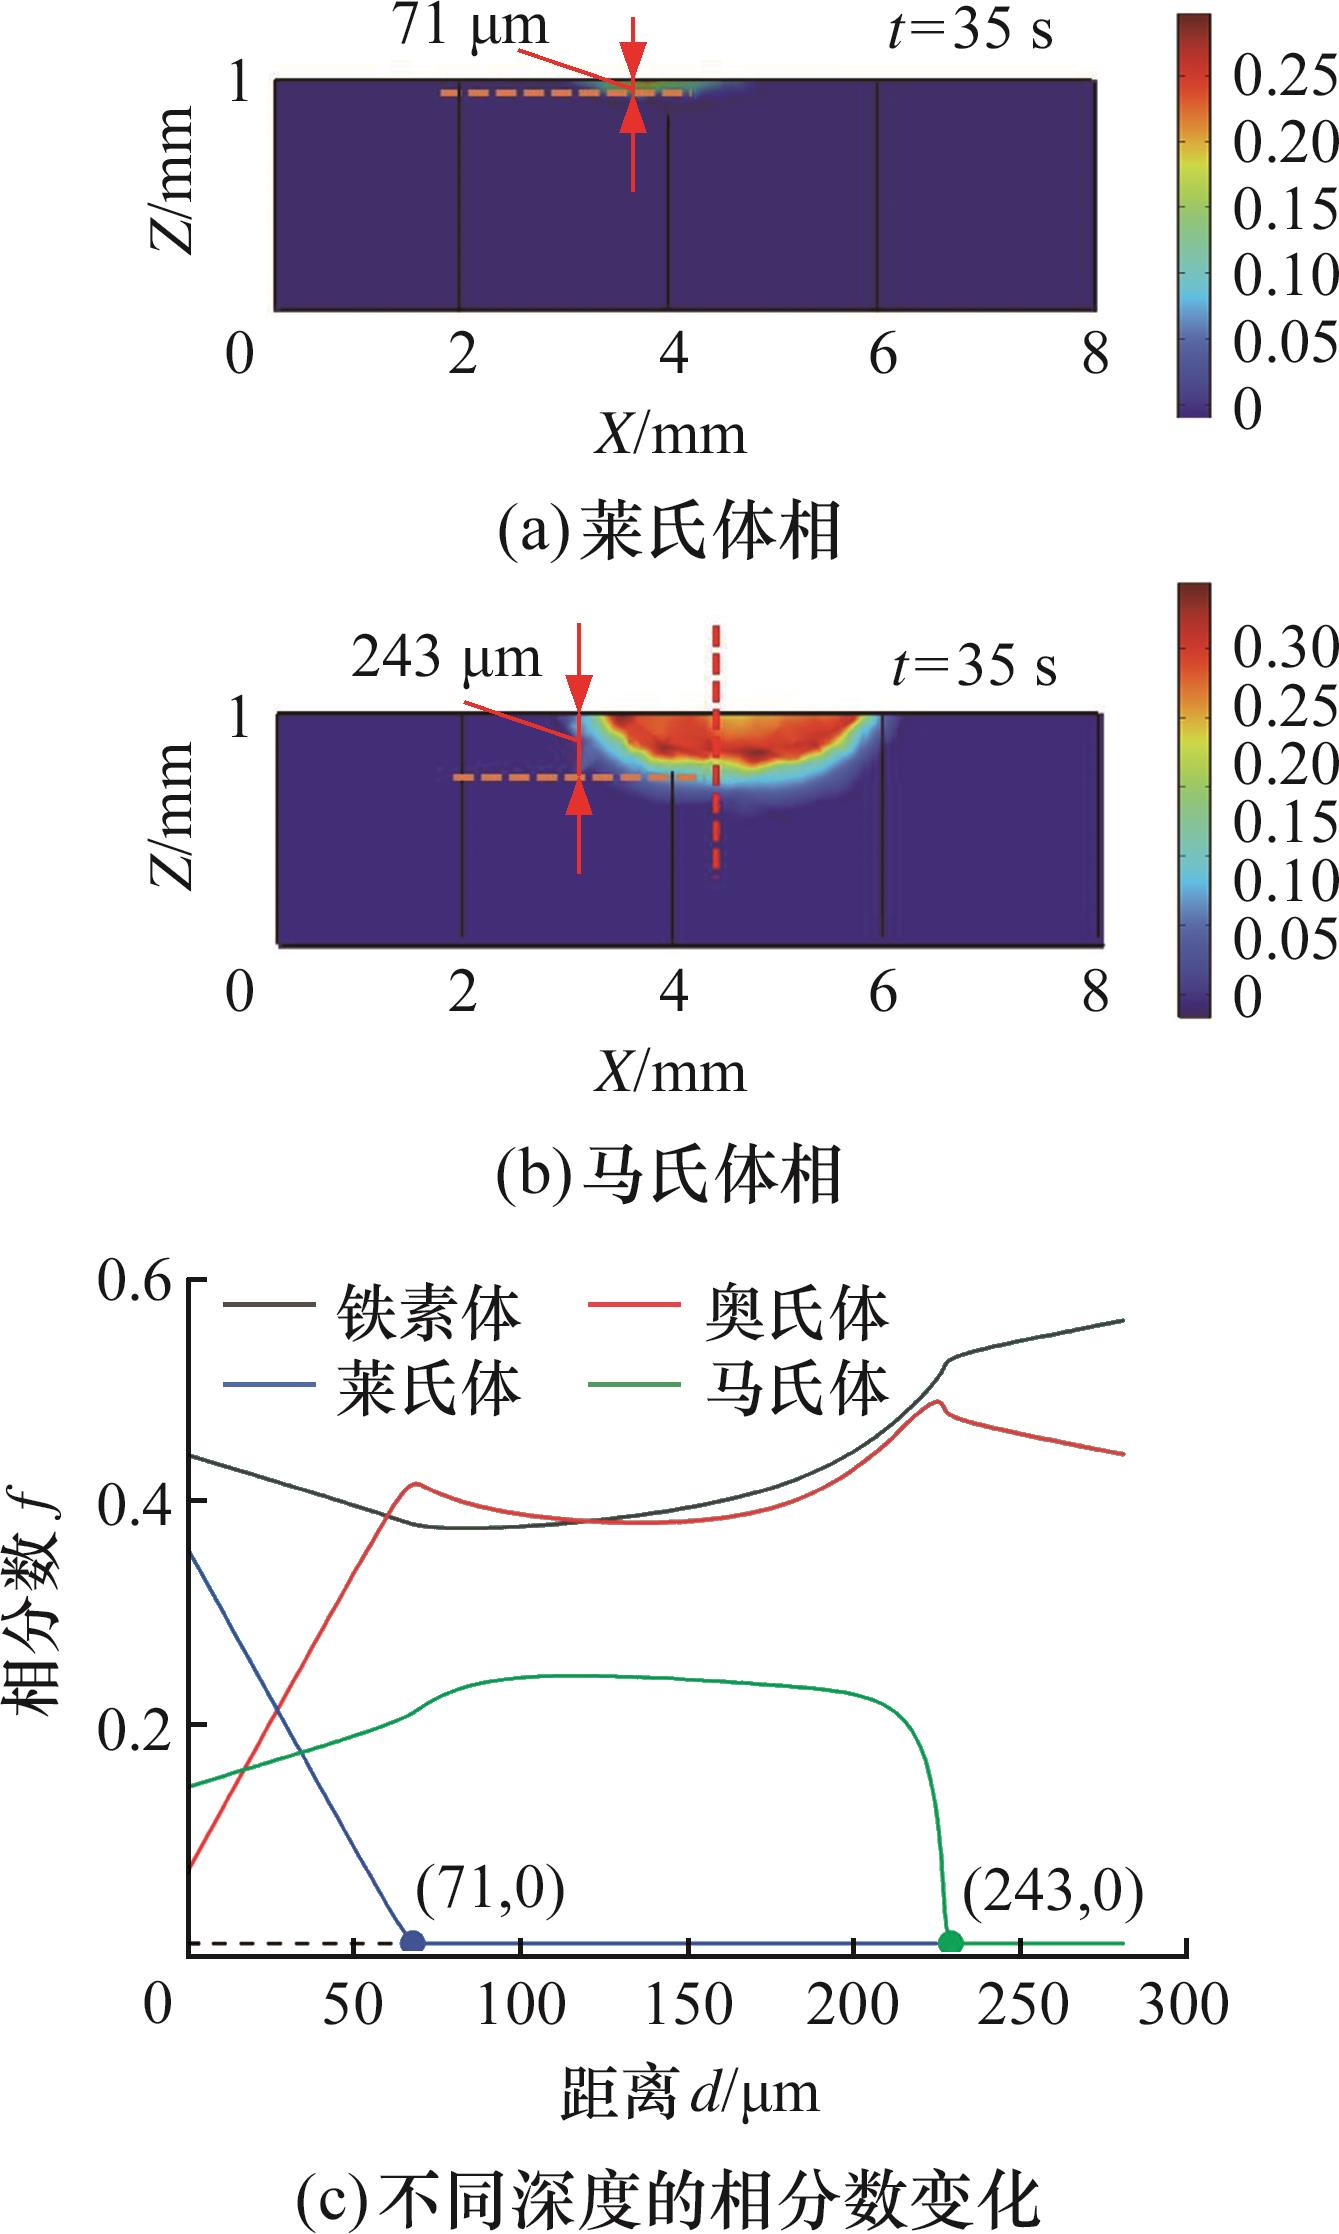
图16 模型相分数验证
Fig.16 Validation of phase fractions
| 目标 | 实验结果 | 模型预测 | 模拟结果 |
|---|---|---|---|
| h | 65 | 74 | 71 |
| H | 225 | 246 | 243 |
表7 实验、模型预测与仿真结果对比 (μm)
Tab.7 Comparison between simulation, prediction and experimental results
| 目标 | 实验结果 | 模型预测 | 模拟结果 |
|---|---|---|---|
| h | 65 | 74 | 71 |
| H | 225 | 246 | 243 |
| 1.建立决策矩阵和标准矩阵 |
|---|
| 式中:帕累托解集组成决策矩阵 A =[aij ] m×n,共m组待决策工艺参数组合,m=50,n个评价指标,n=2; B =[bij ] m×n,为正向化处理得到的矩阵; γ 为标准矩阵。 |
| 2.计算各目标权重值 |
| 式中: |
| 3.计算欧氏距离并输出综合评分 |
| 式中: |
图14 EWM-TOPSIS综合评估方法步骤
Fig.14 Procedures for the comprehensive evaluation method of EWM-TOPSIS
| 1.建立决策矩阵和标准矩阵 |
|---|
| 式中:帕累托解集组成决策矩阵 A =[aij ] m×n,共m组待决策工艺参数组合,m=50,n个评价指标,n=2; B =[bij ] m×n,为正向化处理得到的矩阵; γ 为标准矩阵。 |
| 2.计算各目标权重值 |
| 式中: |
| 3.计算欧氏距离并输出综合评分 |
| 式中: |
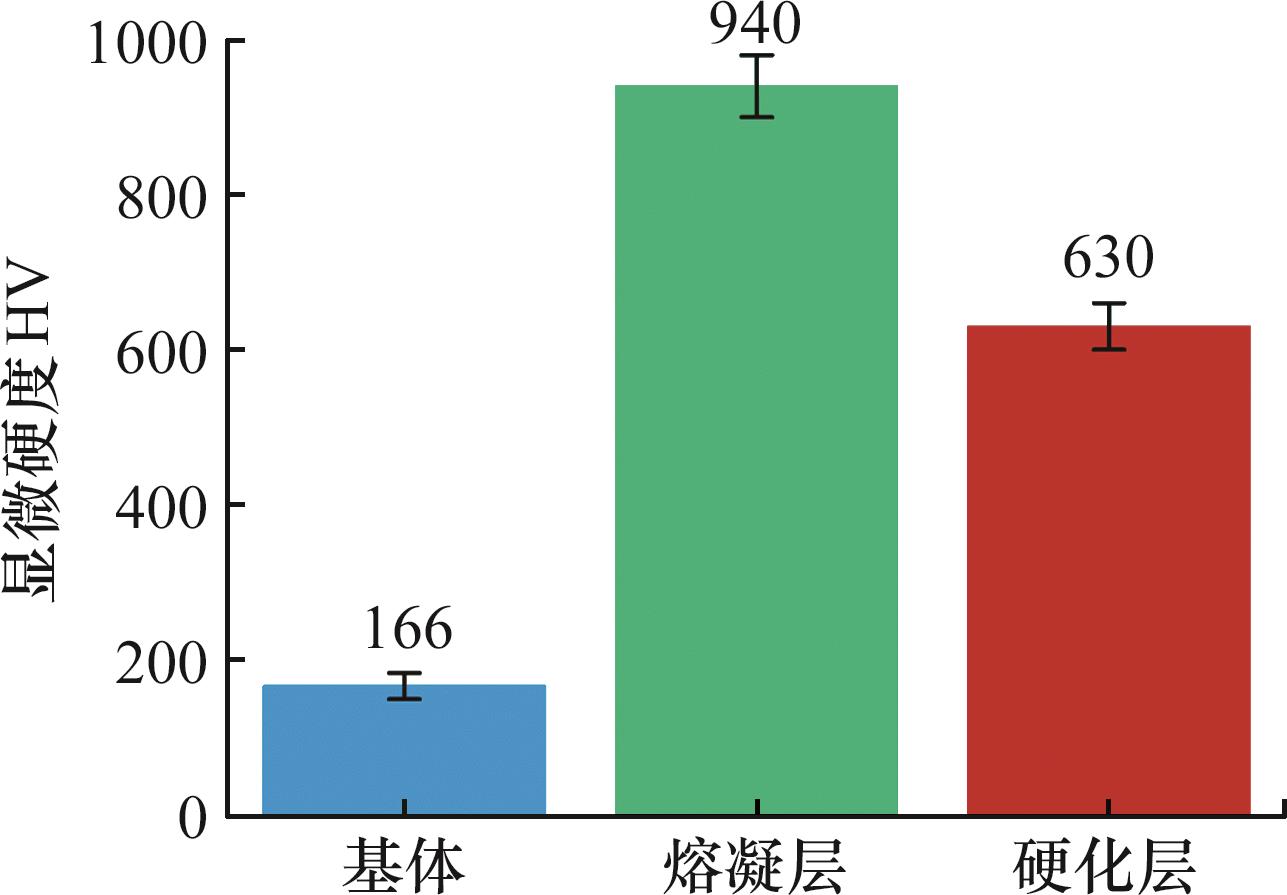
图17 截面硬度
Fig.17 Cross-sectional hardness
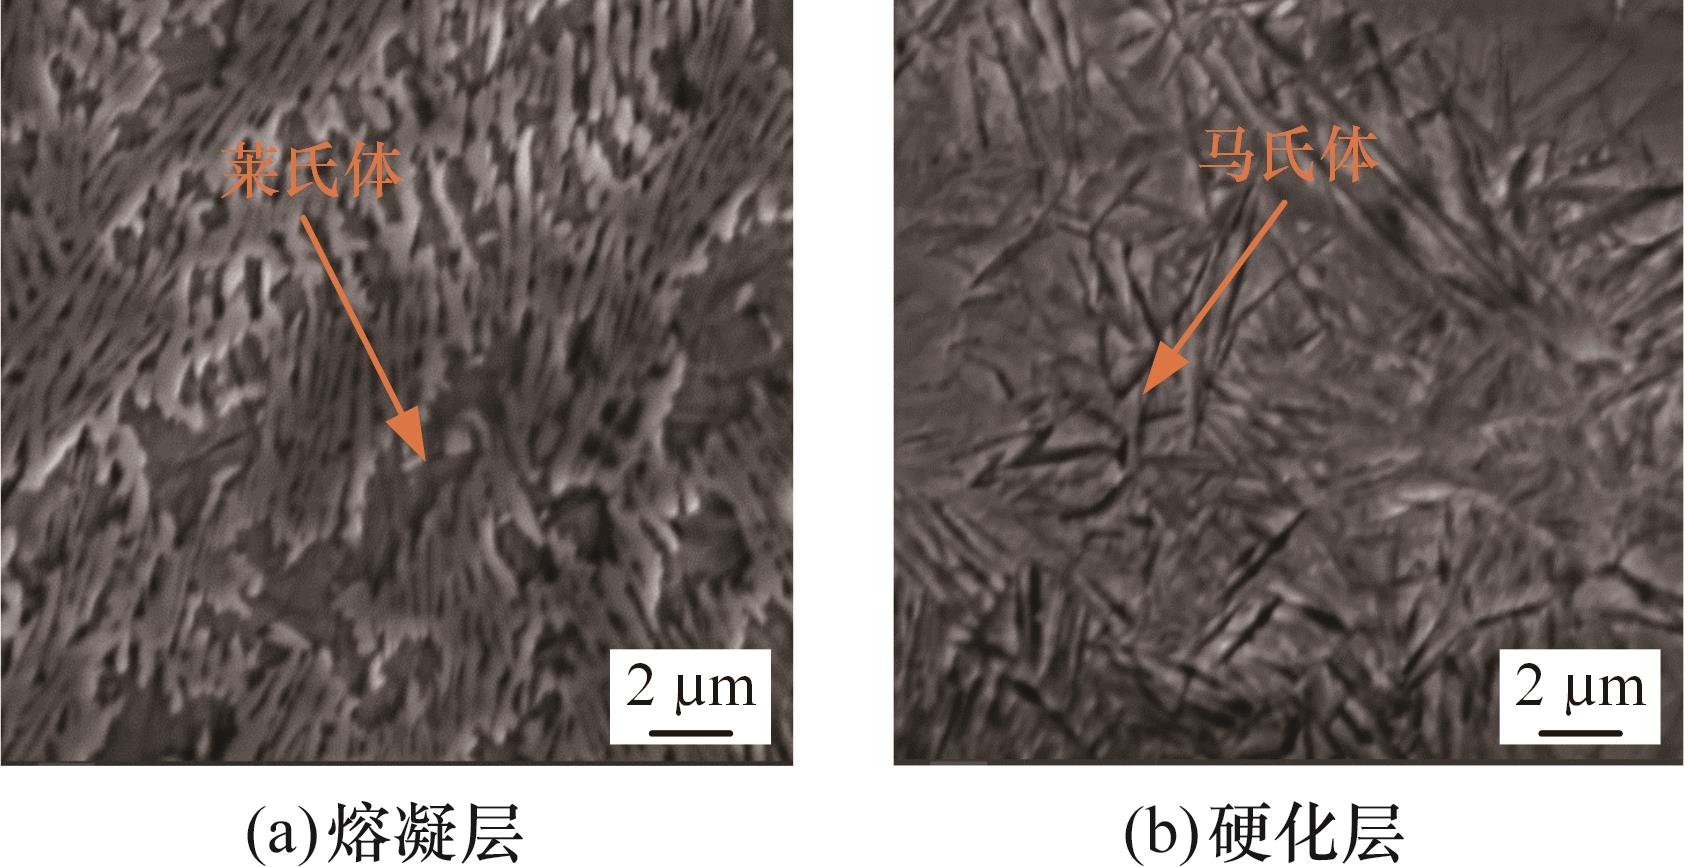
图18 激光硬化后熔凝层和硬化层的显微组织
Fig.18 Microstructures of different zones obtained after laser hardening
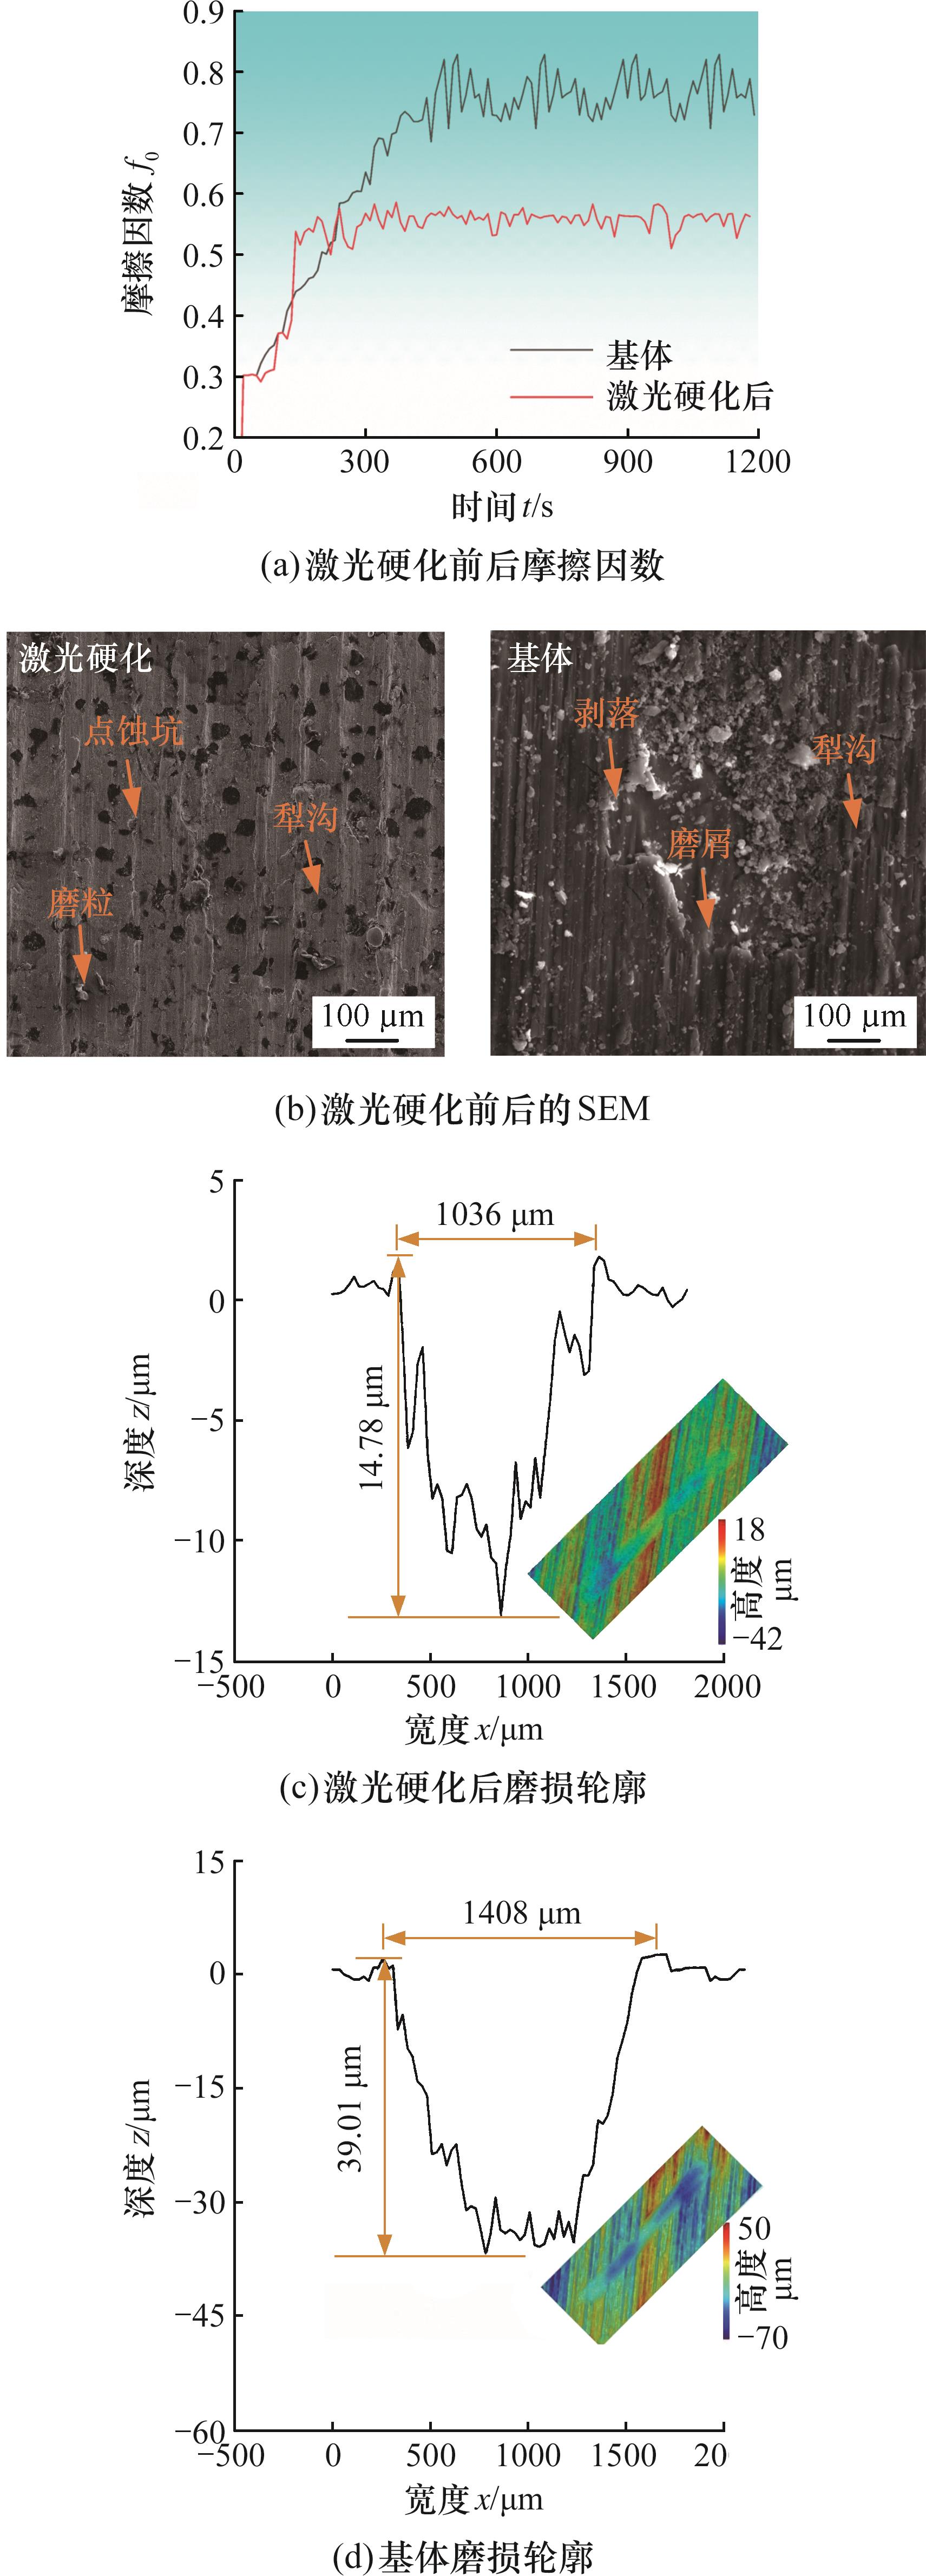
图19 基体和激光硬化后磨损痕迹
Fig.19 Wear tracks of the substrate and the laser-hardened surface.
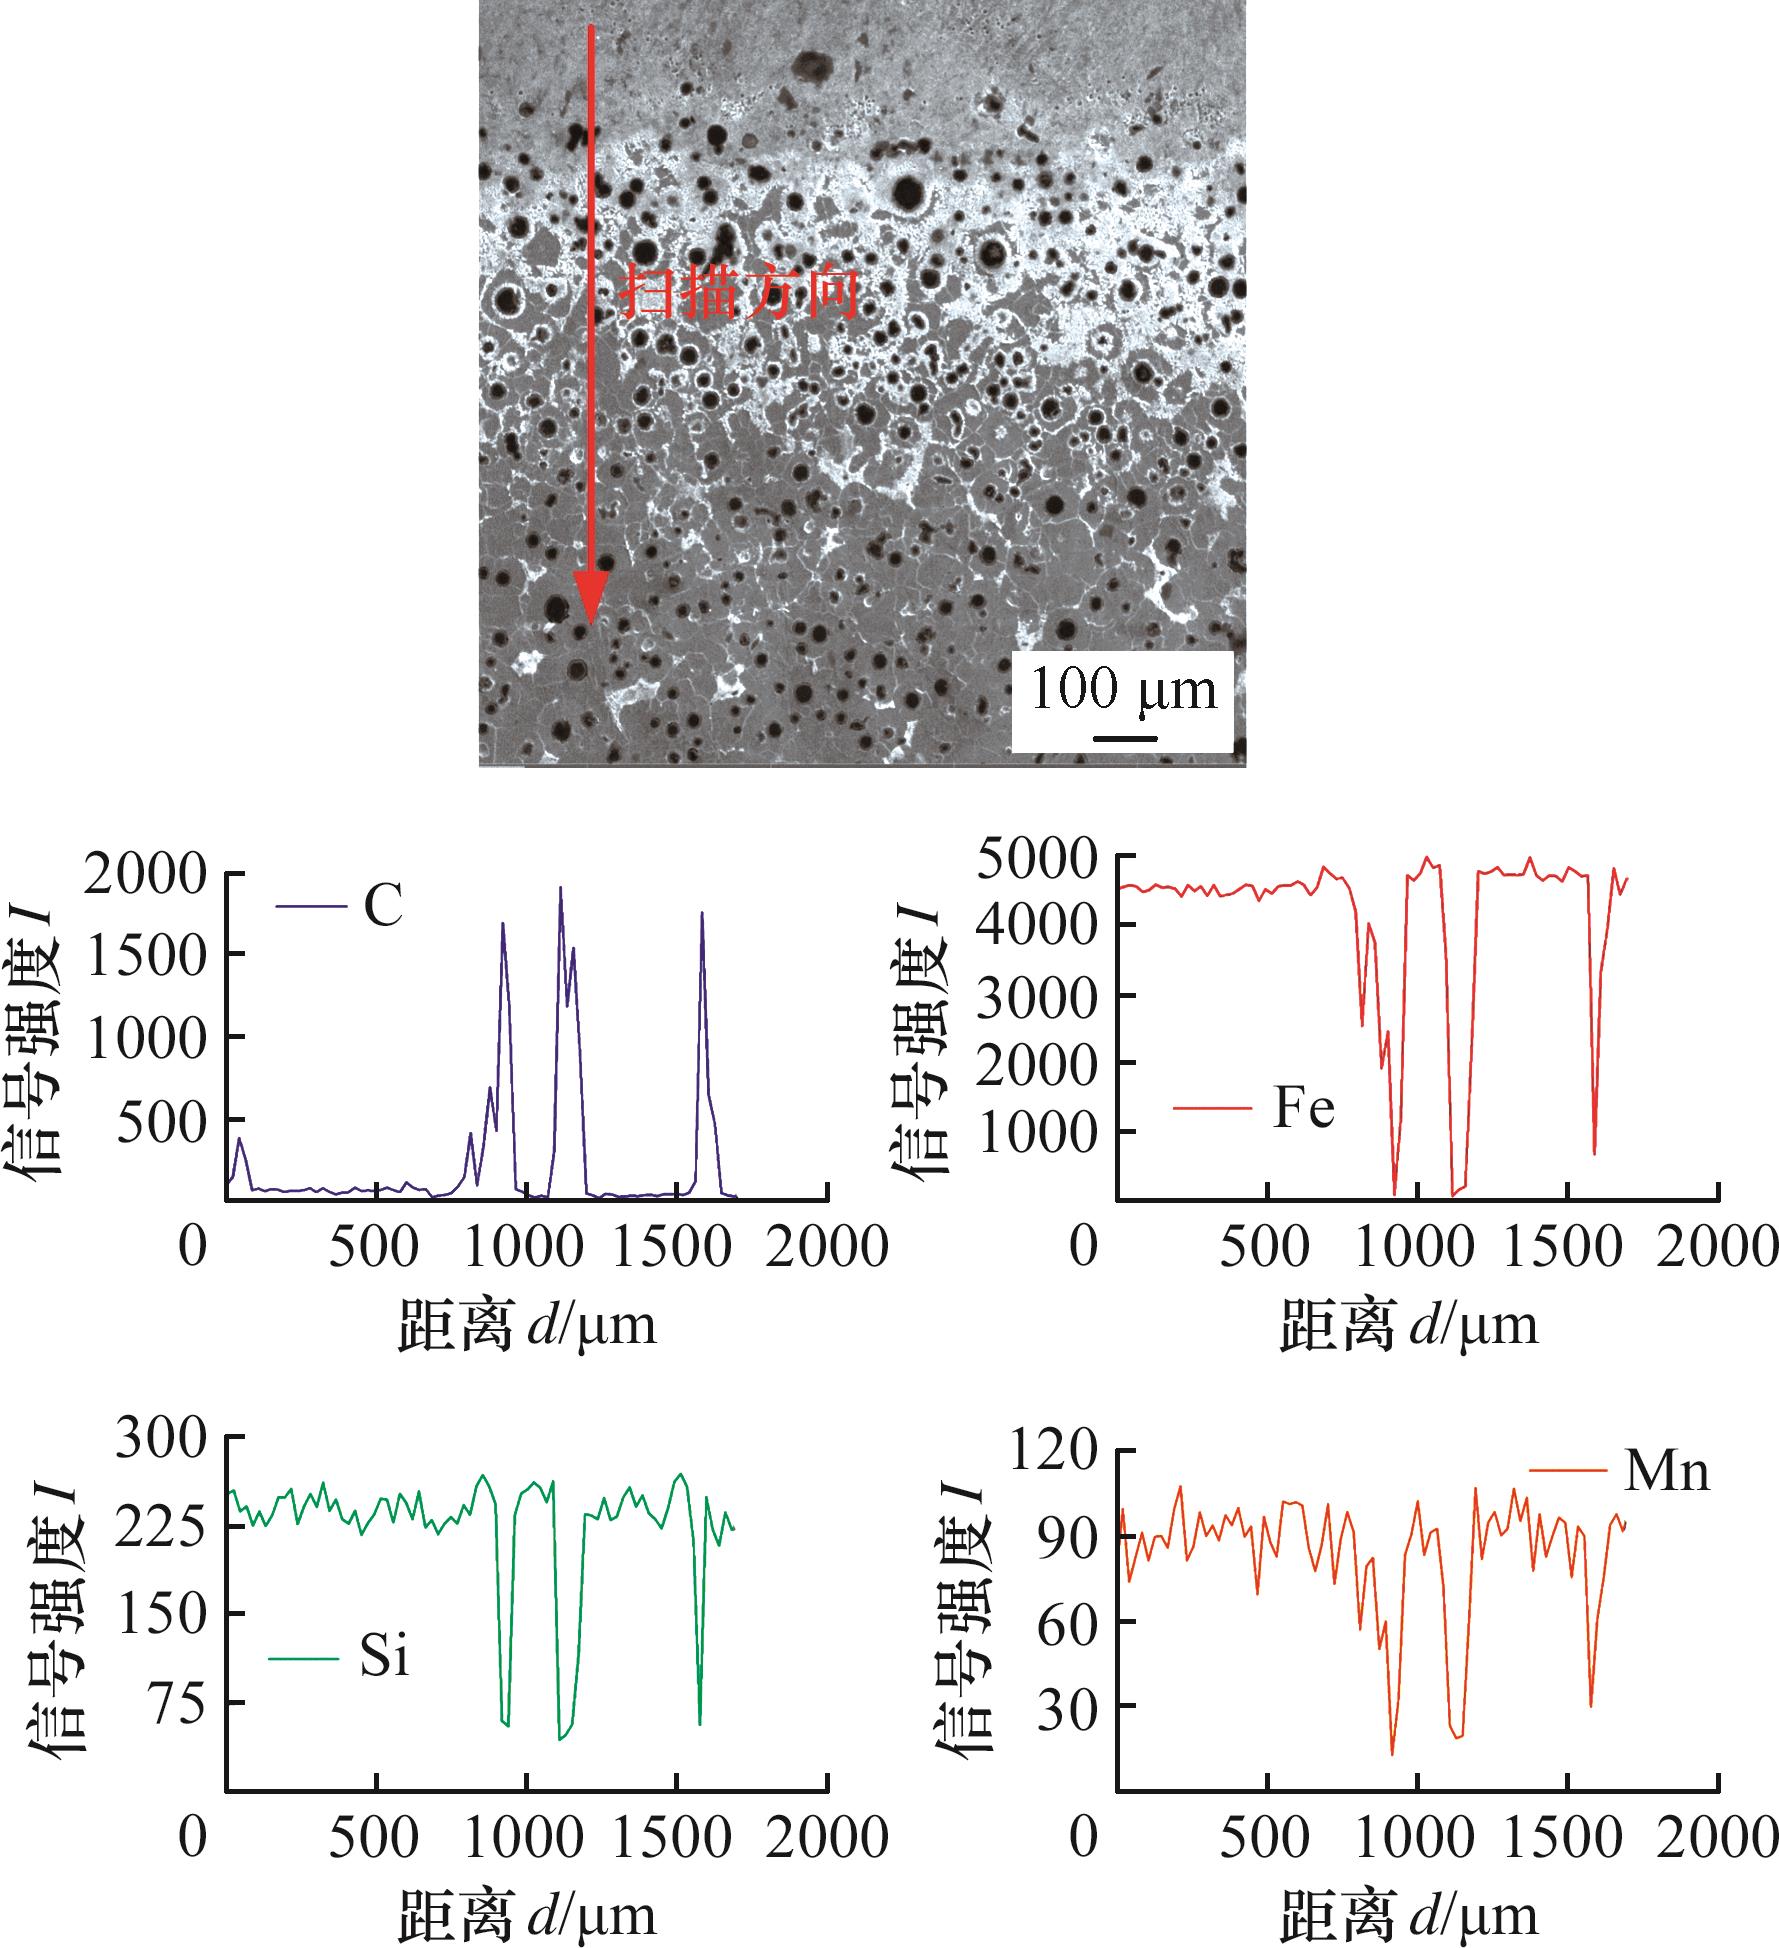
图20 能谱线扫描结果
Fig.20 Energy dispersive line scanning results
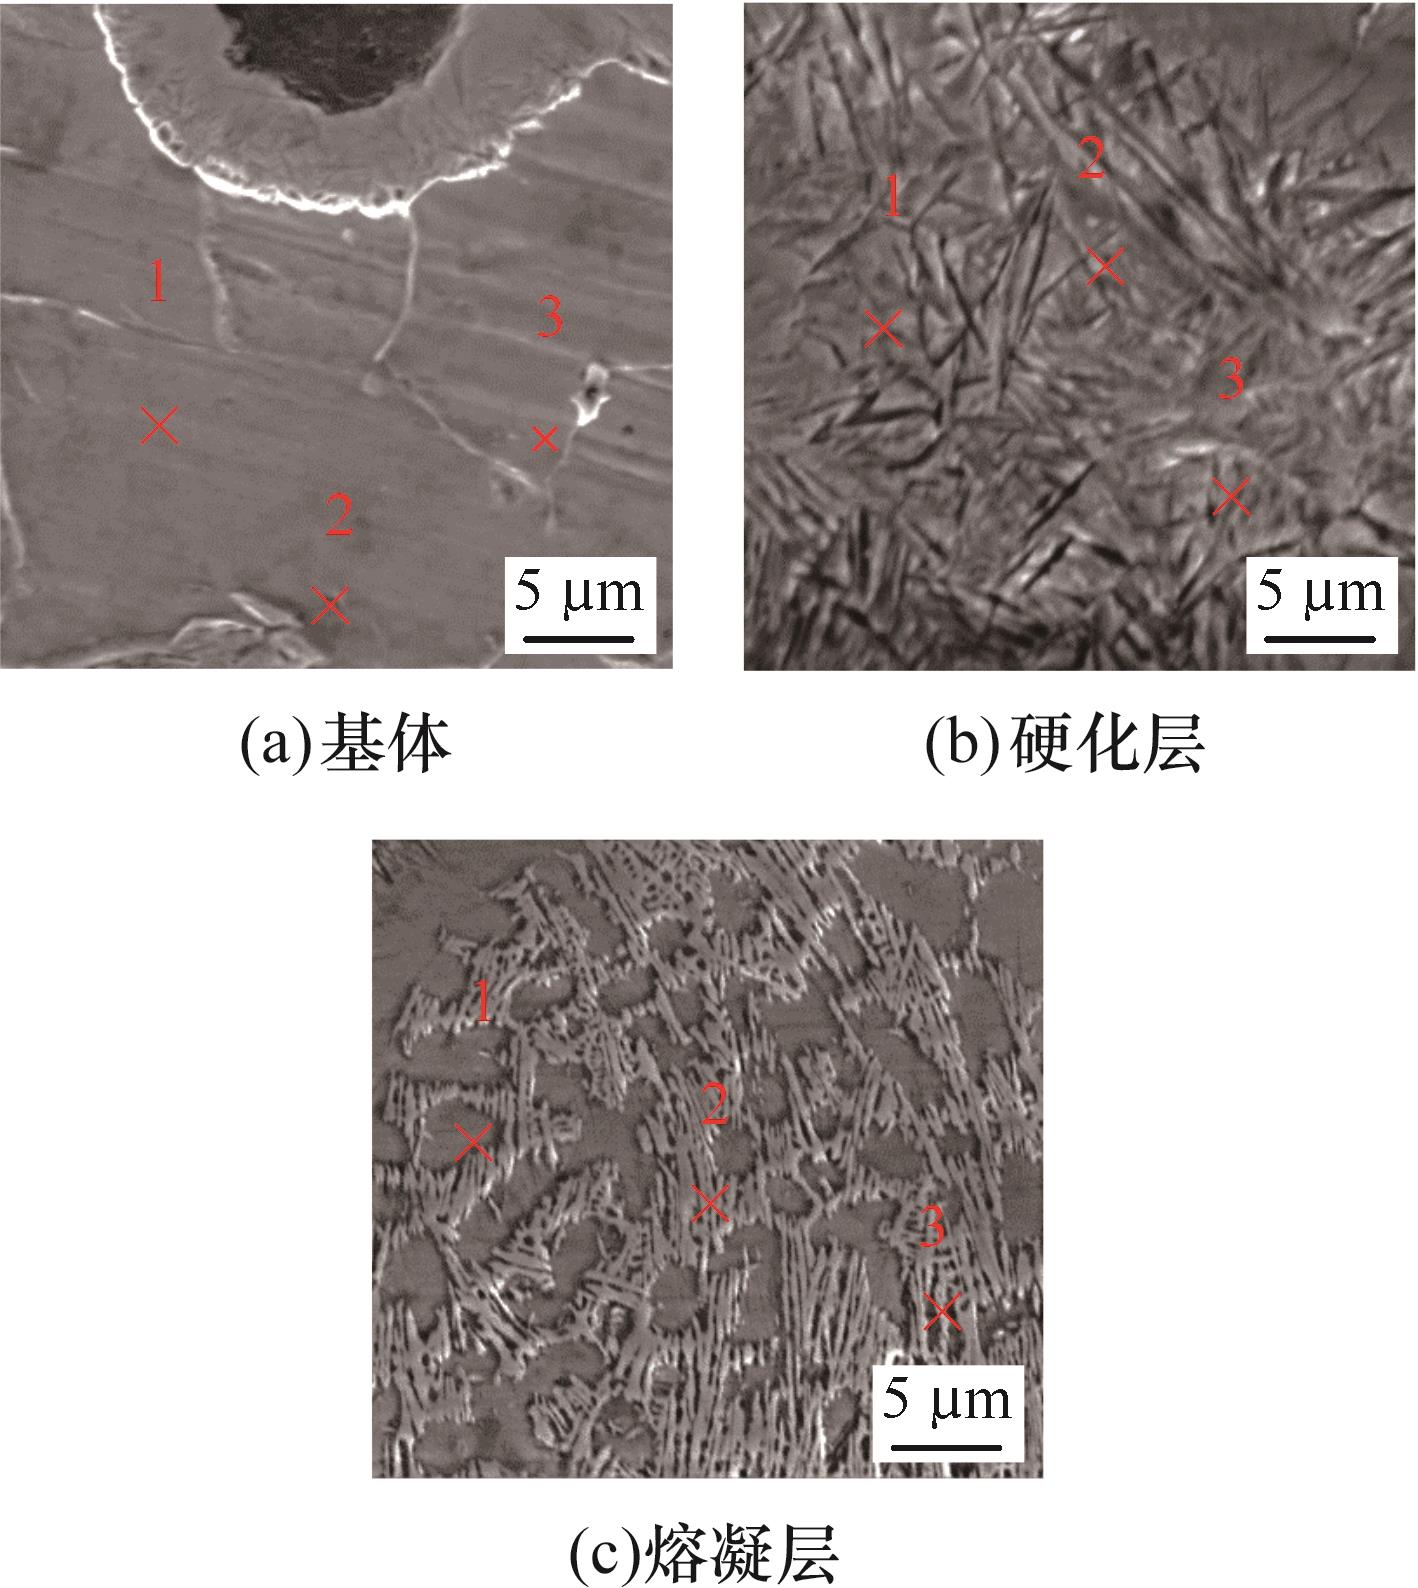
图21 激光硬化后不同区域的显微组织
Fig.21 EDS point analysis spectra of different regions
| 元素 | 点 | 基体 | 熔凝层 | 硬化层 |
|---|---|---|---|---|
| w(C) | 1 | 3.69 | 13.43 | 9.91 |
| 2 | 3.36 | 13.33 | 9.38 | |
| 3 | 4.06 | 13.61 | 10.09 | |
| 平均值 | 3.70 | 13.46 | 9.79 | |
| w(Si) | 1 | 2.27 | 2.75 | 1.91 |
| 2 | 1.87 | 2.69 | 2.01 | |
| 3 | 2.05 | 2.80 | 1.88 | |
| 平均值 | 2.06 | 2.75 | 1.93 | |
| w(Mn) | 1 | 0.19 | 0.08 | 0.34 |
| 2 | 0.16 | 0.09 | 0.25 | |
| 3 | 0.14 | 0.10 | 0.30 | |
| 平均值 | 0.16 | 0.09 | 0.30 | |
| w(Fe) | 其余 | 其余 | 其余 |
表8 各区域EDS定点定量分析结果 (%)
Tab.8 Quantitative EDS point analysis results from different regions
| 元素 | 点 | 基体 | 熔凝层 | 硬化层 |
|---|---|---|---|---|
| w(C) | 1 | 3.69 | 13.43 | 9.91 |
| 2 | 3.36 | 13.33 | 9.38 | |
| 3 | 4.06 | 13.61 | 10.09 | |
| 平均值 | 3.70 | 13.46 | 9.79 | |
| w(Si) | 1 | 2.27 | 2.75 | 1.91 |
| 2 | 1.87 | 2.69 | 2.01 | |
| 3 | 2.05 | 2.80 | 1.88 | |
| 平均值 | 2.06 | 2.75 | 1.93 | |
| w(Mn) | 1 | 0.19 | 0.08 | 0.34 |
| 2 | 0.16 | 0.09 | 0.25 | |
| 3 | 0.14 | 0.10 | 0.30 | |
| 平均值 | 0.16 | 0.09 | 0.30 | |
| w(Fe) | 其余 | 其余 | 其余 |
| [1] | MARTÍNEZ S, LAMIKIZ A, UKAR E, et al. Analysis of the Regimes in the Scanner-based Laser Hardening Process[J]. Optics and Lasers in Engineering, 2017, 90: 72-80. |
| [2] | ZAMMIT A, ABELA S, BETTS J C, et al. Discrete Laser Spot Hardening of Austempered Ductile Iron[J]. Surface and Coatings Technology, 2017, 331: 143-152. |
| [3] | GHAINI F M, AMERI M H, TORKAMANY M J. Surface Transformation Hardening of Ductile Cast Iron by a 600w Fiber Laser[J]. Optik, 2020, 203: 163758. |
| [4] | REDA AL-SAYED S, ELGAZZAR H, NOFAL A. Metallographic Investigation of Laser-treated Ductile Iron Surface with Different Laser Heat Inputs[J]. Ain Shams Engineering Journal, 2023, 14(10): 102189. |
| [5] | CHEN Z, YU X, DING N, et al. Wear Resistance Enhancement of QT700-2 Ductile Iron Crankshaft Processed by Laser Hardening[J]. Optics & Laser Technology, 2023, 164: 109519. |
| [6] | 唐亮, 王文健, 张亚龙, 等. 激光淬火工艺对QT700-2球墨铸铁表面硬度与硬化层深度的影响[J]. 机械工程材料, 2020, 44(5): 82-86. |
| TANG Liang, WANG Wenjian, ZHANG Yalong, et al. Effect of Laser Quenching Process on Surface Hardness and Hardened Layer Depth of QT700-2 Ductile Cast Iron[J]. Materials for Mechanical Engineering, 2020, 44(5): 82-86. | |
| [7] | VESELÝ Z, HONNEROVÁ P, HRUŠKA M, et al. Analysis of Laser Surface Absorptivity Modification for Selective Laser Hardening[J]. International Journal of Thermal Sciences, 2024, 200: 108982. |
| [8] | 杨仁人, 林英华, 彭龙生, 等. 连续高功率激光辐照对55号钢组织和硬度的影响[J]. 中国激光, 2023, 50(16): 155-166. |
| YANG Renren, LIN Yinghua, PENG Longsheng, et al. Effect of Continuous High-power Laser Irradiation on Microstructure and Hardness of 55 Steel[J]. Chinese Journal of Lasers, 2023, 50(16): 155-166. | |
| [9] | 郭怡晖, 刘继常, 卢远志, 等. 球墨铸铁QT600-3激光相变硬化数值模拟研究[J]. 强激光与粒子束, 2010, 22(8): 1755. |
| GUO Yihui, LIU Jichang, LU Yuanzhi, et al. Numerical Simulation of Laser Transformation Hardening of Ductile Cast Iron QT600-3[J]. High Power Laser and Particle Beams, 2010, 22(8): 1755. | |
| [10] | DJURDJEVIC M, JOVANOVIC V, STOPIC S. Quantifying Latent Heat in AlSi5Cu Alloys (with 1, 2, and 4% of Cu by Mass) via DSC, Thermal Analysis, and Commercial Software[J]. Metals, 2025, 15(9): 1045. |
| [11] | MOHAJERANI S, MILLER J D, TUTUNEA-FATAN O R, et al. Thermo-physical Modelling of Track Width during Laser Polishing of H13 Tool Steel[J]. Procedia Manufacturing, 2017, 10: 708-719. |
| [12] | DAVIS M, KAPADIA P, DOWDEN J, et al. Heat Hardening of Metal Surfaces with a Scanning Laser Beam[J]. Journal of Physics D: Applied Physics, 1986, 19(10): 1981. |
| [13] | TEMMLER A, LIU D, PREUßNER J, et al. Influence of Laser Polishing on Surface Roughness and Microstructural Properties of the Remelted Surface Boundary Layer of Tool Steel H11[J]. Materials & Design, 2020, 192: 108689. |
| [14] | DING T, LIU S, WANG Z, et al. A Novel Mixture Sampling Strategy Combining Latin Hypercube Sampling with Optimized One Factor at a Time Method: a Case Study on Mixtures of Antibiotics and Pesticides[J]. Journal of Hazardous Materials, 2024, 461: 132568. |
| [15] | BOURCET J, KUBILAY A, DEROME D, et al. Representative Meteorological Data for Long-term Wind-driven Rain Obtained from Latin Hypercube Sampling- Application to Impact Analysis of Climate Change[J]. Building and Environment, 2023, 228: 109875. |
| [16] | VOŘECHOVSKÝ M. Hierarchical Refinement of Latin Hypercube Samples[J]. Computer-Aided Civil and Infrastructure Engineering, 2015, 30(5): 394-411. |
| [17] | MA S, CHEN Z, ZHANG D, et al. Interpretable Multi-task Neural Network Modeling and Particle Swarm Optimization of Process Parameters in Laser Welding[J]. Knowledge-Based Systems, 2024, 300: 112116. |
| [18] | GUNNING D, STEFIK M, CHOI J, et al. XAI—Explainable Artificial Intelligence[J]. Science Robotics, 2019, 4(37): eaay7120. |
| [19] | BELLE V, PAPANTONIS I. Principles and Practice of Explainable Machine Learning[J]. Frontiers in Big Data, 2021, 4: 688969. |
| [20] | TJOA E, GUAN C. A Survey on Explainable Artificial Intelligence (XAI): Toward Medical XAI[J]. IEEE Transactions on Neural Networks and Learning Systems, 2021, 32(11): 4793-4813. |
| [21] | NOVAKOVSKY G, DEXTER N, LIBBRECHT M W, et al. Obtaining Genetics Insights from Deep Learning via Explainable Artificial Intelligence[J]. Nature Reviews Genetics, 2023, 24(2): 125-137. |
| [22] | AMIRI M H, MEHRABI HASHJIN N, MONTAZERI M, et al. Hippopotamus Optimization Algorithm: a Novel Nature-inspired Optimization Algorithm[J]. Scientific Reports, 2024, 14: 5032. |
| [23] | 郑文祥, 刘静, 陈家辉. HOA和SPEA2结合的边缘云计算任务卸载优化[J]. 计算机技术与发展, 2025, 35(4): 7-14. |
| ZHENG Wenxiang, LIU Jing, CHEN Jiahui. Optimization of Edge Cloud Computing Task Offloading Combining HOA and SPEA2[J]. Computer Technology and Development, 2025, 35(4): 7-14. | |
| [24] | LV J, SUN Y, ZHANG Z, et al. Optimization of Operational Parameters of Marine Methanol Dual-fuel Engine Based on RSM-MOPSO[J]. Process Safety and Environmental Protection, 2024, 191: 2634-2652. |
| [25] | 蒋荣超, 刘大维, 王登峰. 基于熵权TOPSIS方法的整车动力学性能多目标优化[J]. 机械工程学报, 2018, 54(2): 150-158. |
| JIANG Rongchao, LIU Dawei, WANG Dengfeng. Multi-objective Optimization of Vehicle Dynamics Performance Based on Entropy Weighted TOPSIS Method[J]. Journal of Mechanical Engineering, 2018, 54(2): 150-158. |
| [1] | 肖伟, 张聪, 陈绪兵. 基于贝叶斯优化时间卷积网络的工业机器人能耗预测[J]. 中国机械工程, 2026, 37(4): 831-836. |
| [2] | 郭玉琴, 尹航, 杨栋杰, 刘晨曦, 李富柱. 频率偏移补偿协同分步逐级优化的端/侧两面加工宽刃超声工具头设计方法[J]. 中国机械工程, 2025, 36(12): 2903-2910. |
| [3] | 王志, 李善夫, 田晶, 岳梦康. 刚度自调谐宽频动力吸振器设计与试验研究[J]. 中国机械工程, 2025, 36(11): 2593-2600. |
| [4] | 郑燕. 磨料水射流修复钢轨工艺参数优化研究[J]. 中国机械工程, 2025, 36(05): 1132-1141. |
| [5] | 徐平, 罗晶, 于英华, 沈佳兴, 黎文利. 织构化盘式摩擦副性能及优化设计研究[J]. 中国机械工程, 2024, 35(10): 1774-1782. |
| [6] | 成艾国1, 王超1, 陆日进2, 何智成1, 于万元3. 复合材料尾门结构的拓扑参数一体化轻量化设计[J]. 中国机械工程, 2024, 35(10): 1824-1833. |
| [7] | 王昕, 代亮成, 杨东晓, 罗贇, 池茂儒, 郭兆团, 曾鹏程. 车端侧滚减振装置对高速双层动车组动力学性能的影响分析[J]. 中国机械工程, 2024, 35(04): 742-751. |
| [8] | 刘孝保, 严清秀, 易斌, 姚廷强, 顾文娟. 基于集成学习和改进粒子群优化算法的流程制造工艺参数优化[J]. 中国机械工程, 2023, 34(23): 2842-2853. |
| [9] | 唐洋, 张吴镝, 张玉林, 王远, . 管道封堵机器人的卡瓦承压性能与管壁损伤特性仿真与试验研究[J]. 中国机械工程, 2023, 34(22): 2758-2771. |
| [10] | 张明亮, 杨大伟, 李明远, 杨新梦, 刘丽茹, 张连朋. 永磁轨道参数优化和悬浮力特性研究[J]. 中国机械工程, 2023, 34(19): 2370-2380. |
| [11] | 胡博, 罗炜韬, 王少飞, 蓝希旺. 基于支持向量机参数优化的高温合金表面缺陷磁异常定量研究[J]. 中国机械工程, 2023, 34(17): 2058-2064. |
| [12] | 孙家乐, 罗晨, 周怡君, 王伟, 张刚. 复杂视觉测量系统的标定参数优化及精度评估[J]. 中国机械工程, 2023, 34(14): 1741-1748,1755. |
| [13] | 李国龙, 朱国华, 蒋林, 陶一杰, 贾亚超. 抑制磨削振纹的多目标磨削工艺参数优化[J]. 中国机械工程, 2023, 34(09): 1086-1092. |
| [14] | 王庆港, 陈源, 彭旭东, 李运堂, 李孝禄, 王冰清, 金杰. 三自由度微扰下箔片端面气膜密封动态特性分析[J]. 中国机械工程, 2022, 33(15): 1828-1840. |
| [15] | 王仙业, 刘海涛, 黄田. 一种平面闭链腿式机构的尺度参数优化设计[J]. 中国机械工程, 2022, 33(11): 1261-1268. |
| 阅读次数 | ||||||
|
全文 |
|
|||||
|
摘要 |
|
|||||